
P50 & P90 simplified: Two figures, all investors should understand, to build a reliable business plan when investing in wind assets
P50 & P90 simplified: Two figures, all investors should understand, to build a reliable business plan when investing in wind assets
P50 & P90 simplified
When you invest in wind energy assets, whether they are new or you acquire them on the secondary market you should be aware of two key figures which are critical for your forecasting and business plan assumptions; these are P50 and P90.
One of the critical risks when investing in the wind energy sector is the inconsistency of the wind resource compared to the forecast. No one can predict the wind right. Energy yield assessment studies are performed by wind experts to provide the Net Yield and exceedance probability figures, to mitigate that risk
This article aims to simplify the terms and explain in plain English the difference between all the jargon, helping you to select the most appropriate figure when creating your revenue forecast and business model.
The Basic Definitions
P50 and P90 are probability figures. The P50 figure is the annual average level of generation, where the output is forecasted to be exceeded 50% over a year. The P90 figure is the level of the annual generation that is predicted to be exceeded 90% over a year.
The process of calculating the P50
When developing a wind farm project, one crucial step consists the collection of on-site wind measurements over the minimum period of one year. As there is no accurate model to predict wind, analysis over a short-term period is used in conjunction with historical data to create a wind forecasting model for the specific geographical area. Land-based stations or mesoscale models provide the data. Numeric models and long-term forecast correction processes are used to derive an acceptable wind distribution model over the life span of the wind farm. Finally, the wind resource at each turbine location is converted into generation figures by utilising the theoretical power curve of the selected turbine model.
The result from this whole process is called Gross Yield.
The Net Yield figure derives from the Gross Yield, after taking into consideration the losses during the project lifetime. According to the latest forecasting trends and best practices, we can identify losses as the following:
- Wake losses
- Turbine availability and maintenance losses
- Grid and BOP (Balance of Plant) availability
- Electrical losses
- Siting conditions
- Blade degradation
- Curtailment plans
Moving from P50 to P90
When evaluating the Net Yield, each step of the applied methodology is subject to uncertainties. The identification and quantification of uncertainties are crucial to determine the correct exceedance probabilities.
It is possible to identify two categories of uncertainties:
- The variation in wind
- The modelling errors
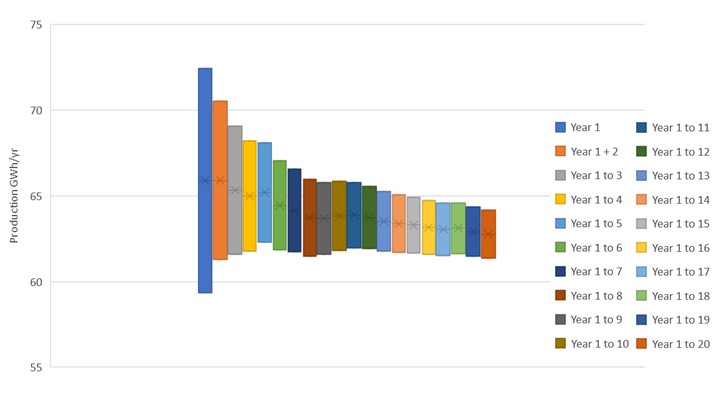
The first category refers to the variability of the wind resource over time. Experience shows that we can have significant variations from one year to another. Unfortunately, no model can forecast those changes. In this context, an uncertainty is calculated to account for inter-annual variation over the wind farm lifetime. The longer the lifespan of the project is, the more likely it is to reach the P50 in cumulated production.
Example: Assuming a P50 around 63 GWh/yr., the graph below illustrates the convergence towards P50 reasoning in cumulated production.
The second category refers to the model uncertainty; i.e. uncertainties related to each step of the applied methodology, due to the use of mathematical and numerical models as:
- Site measurement
- Vertical profile
- Reference data
- Long-term correction
- Wind flow modelling
- Wake modelling
- Density
- Power curve
- Other
Case study
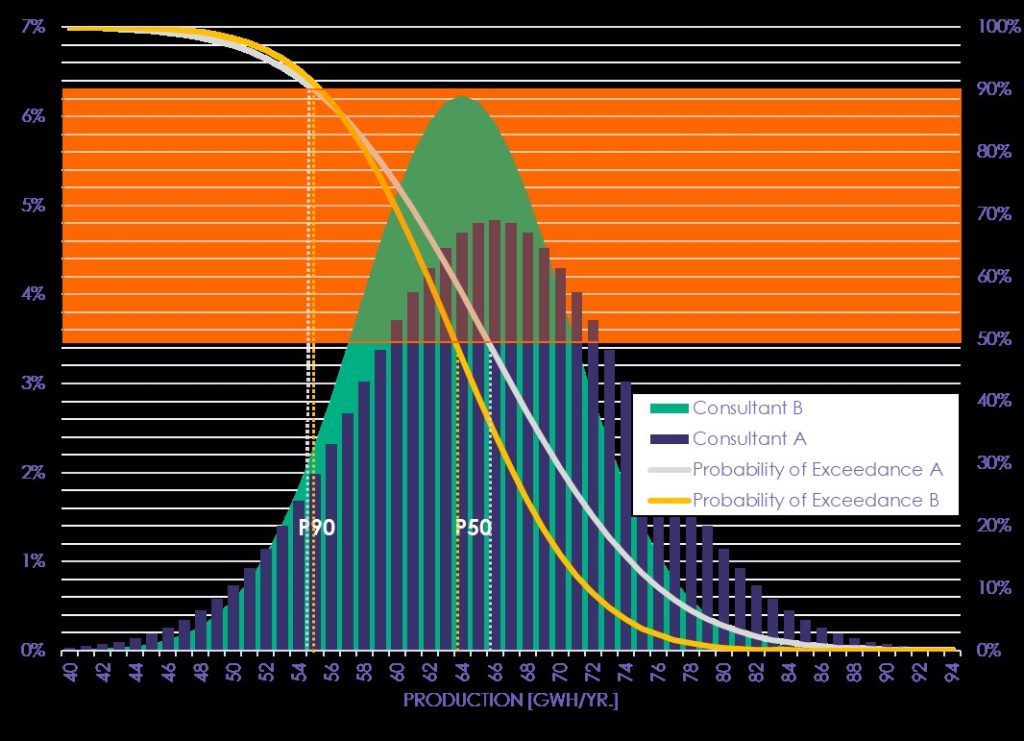
Example: Assuming a wind project under development for which two different consultants performed independent energy yield studies leading to the figures below:

The graph below illustrates the probability exceedance associated with the Net Yield calculated by each consultant. While results in P50 differ 3%, both consultants obtain a similar P90. The explanation is that the study of Consultant A assumes a higher overall uncertainty percentage.
Avoid using the P50 figure
Unfortunately, there is no safe way to predict wind over a long period, let alone for 20 years. Therefore, the models and methods used for energy yield assessments are subject to errors, so the assumptions made for uncertainties are crucial for the revenue forecasting and the business model. One thing is sure, the wind resources on a specific location of a wind farm can and will change over time, as the topographic evolution or human-made interventions can have an impact (urbanisation, densification of neighboured wind turbines, vegetation growth, etc).
Greensolver, highly recommends avoiding any forecasting based on the P50 figure. We would suggest using the P90 or P75 figures instead, depending on the quality of the energy yield assessment. Finally, keep in mind that to determine the quality of an energy yield assessment, a review performed by an independent expert is vital. Get in touch for more details!
Co-Authors: Perrine Bugeat & Ypatios Moysiadis