P50 and P90: Wind Energy Measurement

P50 and P90: Wind Energy Measurement
When you invest in wind energy assets, whether they are new or you acquire them on the secondary market you should be aware of two key figures which are critical for your forecasting and business plan assumptions; these are P50 and P90.
Introduction
One of the most important risks when investing in the wind energy sector is the variability of the wind resource, compared to the forecast. To minimise this risk, energy yield assessment studies are performed by wind experts to provide the Net Yield and exceedance probability figures.
The aim of this article is to understand the difference between all these terms in order to help you select the most appropriate figure when creating your business model.
Definitions
P50 and P90 are probability figures. The P50 figure is the average level of generation, where the output is forecasted to be exceeded 50% over the projects life. The P90 figure is the level of generation that is predicted to be exceeded 90% of the projects life.
From wind measurements to P50
When developing a wind farm project, it is important to collect on-site wind measurements over a minimum of a one year period. As no one can predict the wind over the next 20 years, the data measured at the meteorological mast over a short-term period are extrapolated to the future, using historical data. This data is provided by land-based stations or mesoscale models. The wind distribution issued from the long-term correction process is then extrapolated to the future wind turbine locations using numerical models. Finally, the wind resource at each turbine location is converted into production via the theoretical power curve of the selected turbine model.
The result from this whole process is called Gross Yield.
The Net Yield figure is derived from the Gross Yield by including the losses all over the project lifetime. According to the latest and best practices, these losses are;
- turbine availability and maintenance losses
- grid and BOP availability
- electrical losses
- siting conditions
- blade degradation
- curtailment plans
Moving from P50 to P90
When evaluating the Net Yield, each step of the applied methodology is subject to some uncertainties. The identification and quantification of uncertainties is crucial to determine the correct exceedance probabilities.
It is possible to distinguish two classes:
- The variation in wind
- The modelling errors
The first category refers to the variability of the wind resource over time. It is known that large variations could be observed from one year to another with no forecast possible. In this context, an uncertainty is calculated to account for inter-annual variation over the wind farm’s lifetime. The longer the project lifetime, the more likely it is to reach the P50 in cumulated production. Read here more about reducing P50 uncertainties.
The second category refers to the model uncertainty; i.e. uncertainties related to each step of the applied methodology due to the use of mathematical and numerical models; site measurement, vertical profile, reference data, long-term correction, wind flow modelling, wake modelling, density, and power curve.

Conclusion
As no one can predict the wind over the next 20 years and because the models and methods used for energy yield assessments are subject to errors, the consideration of an uncertainty is crucial when creating a business model. This is all the more relevant as the wind resource over the wind farm site area can be affected over time by evolution in the immediate vicinity: urbanisation, densification of neighboured wind turbines, tree growth etc.
Greensolver highly recommends to consider the P90 or P75 figures instead of the P50, depending on the quality of the energy yield assessment. To determine the quality of an energy yield assessment, a review performed by an independent expert is essential. Get in touch for more details!
By Carla Vico, Operations Director
The Latest Renewable Energy News
Webinar Replay – Modeling the Economic Potential of BESS: How to Manage Uncertainty | June 17, 2:00 p.m. CET

Greensolver will be attending the 12th GreenUnivers Infrastructure Financing Conference on July 1
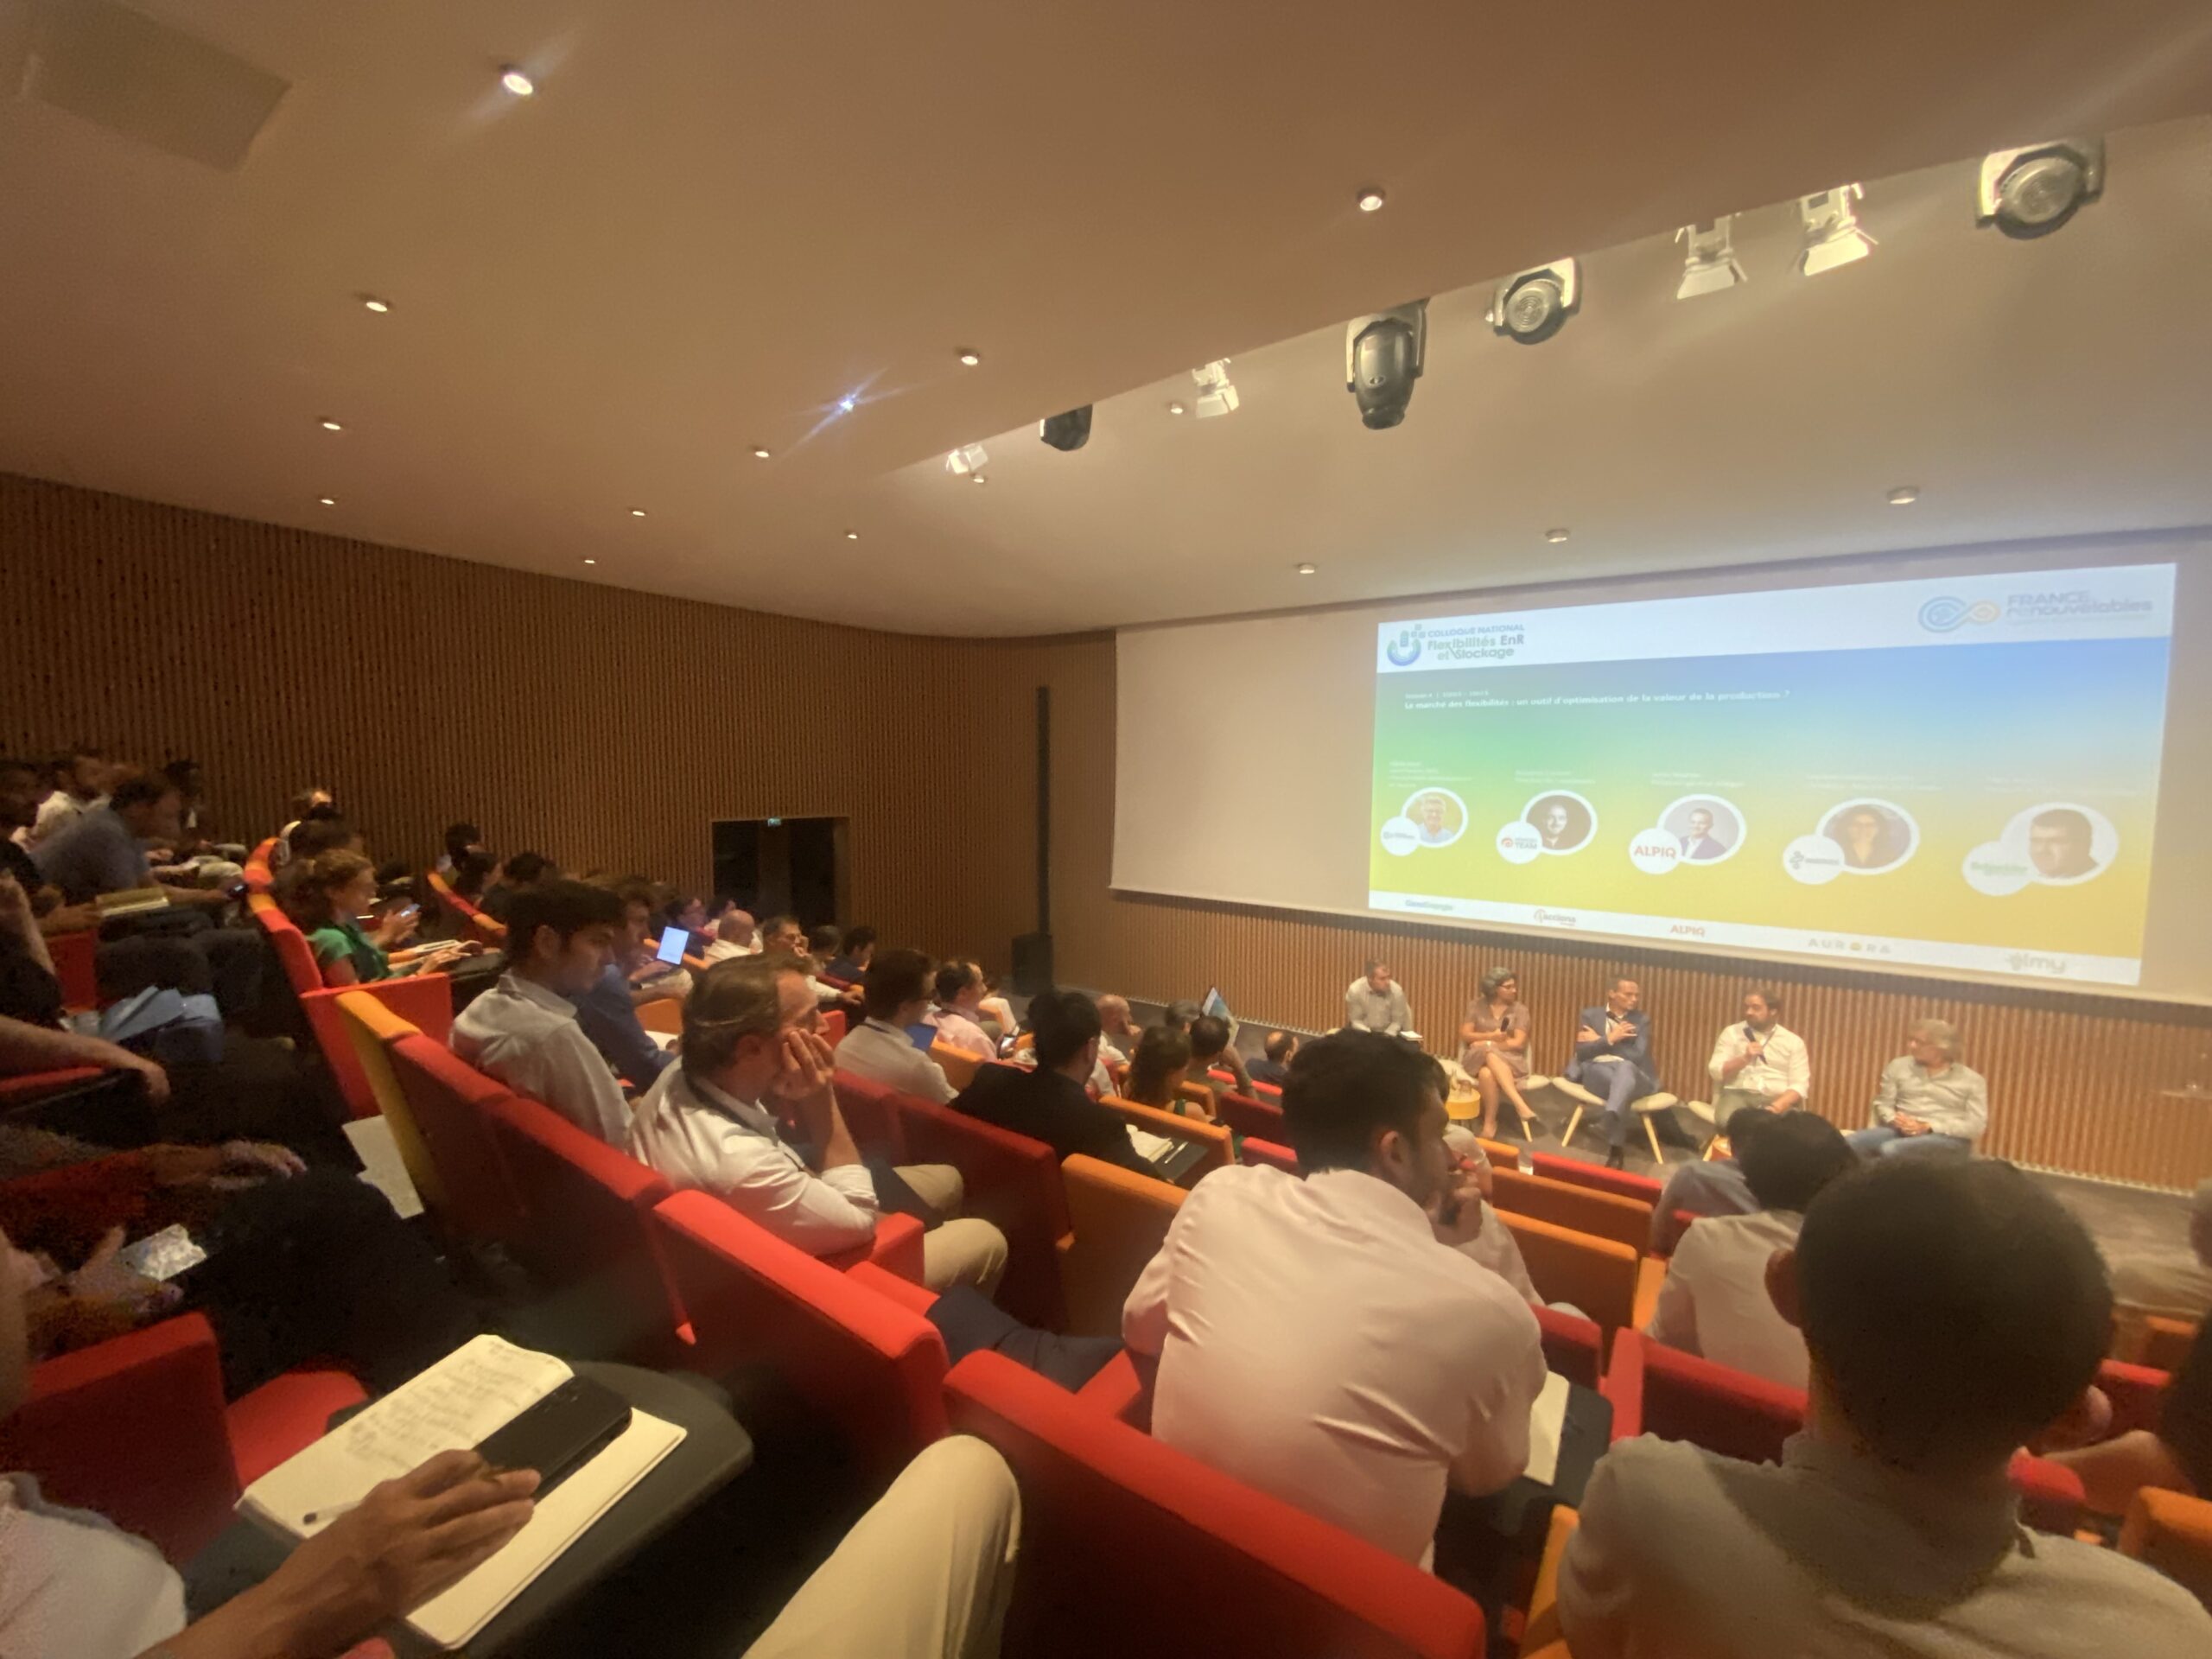
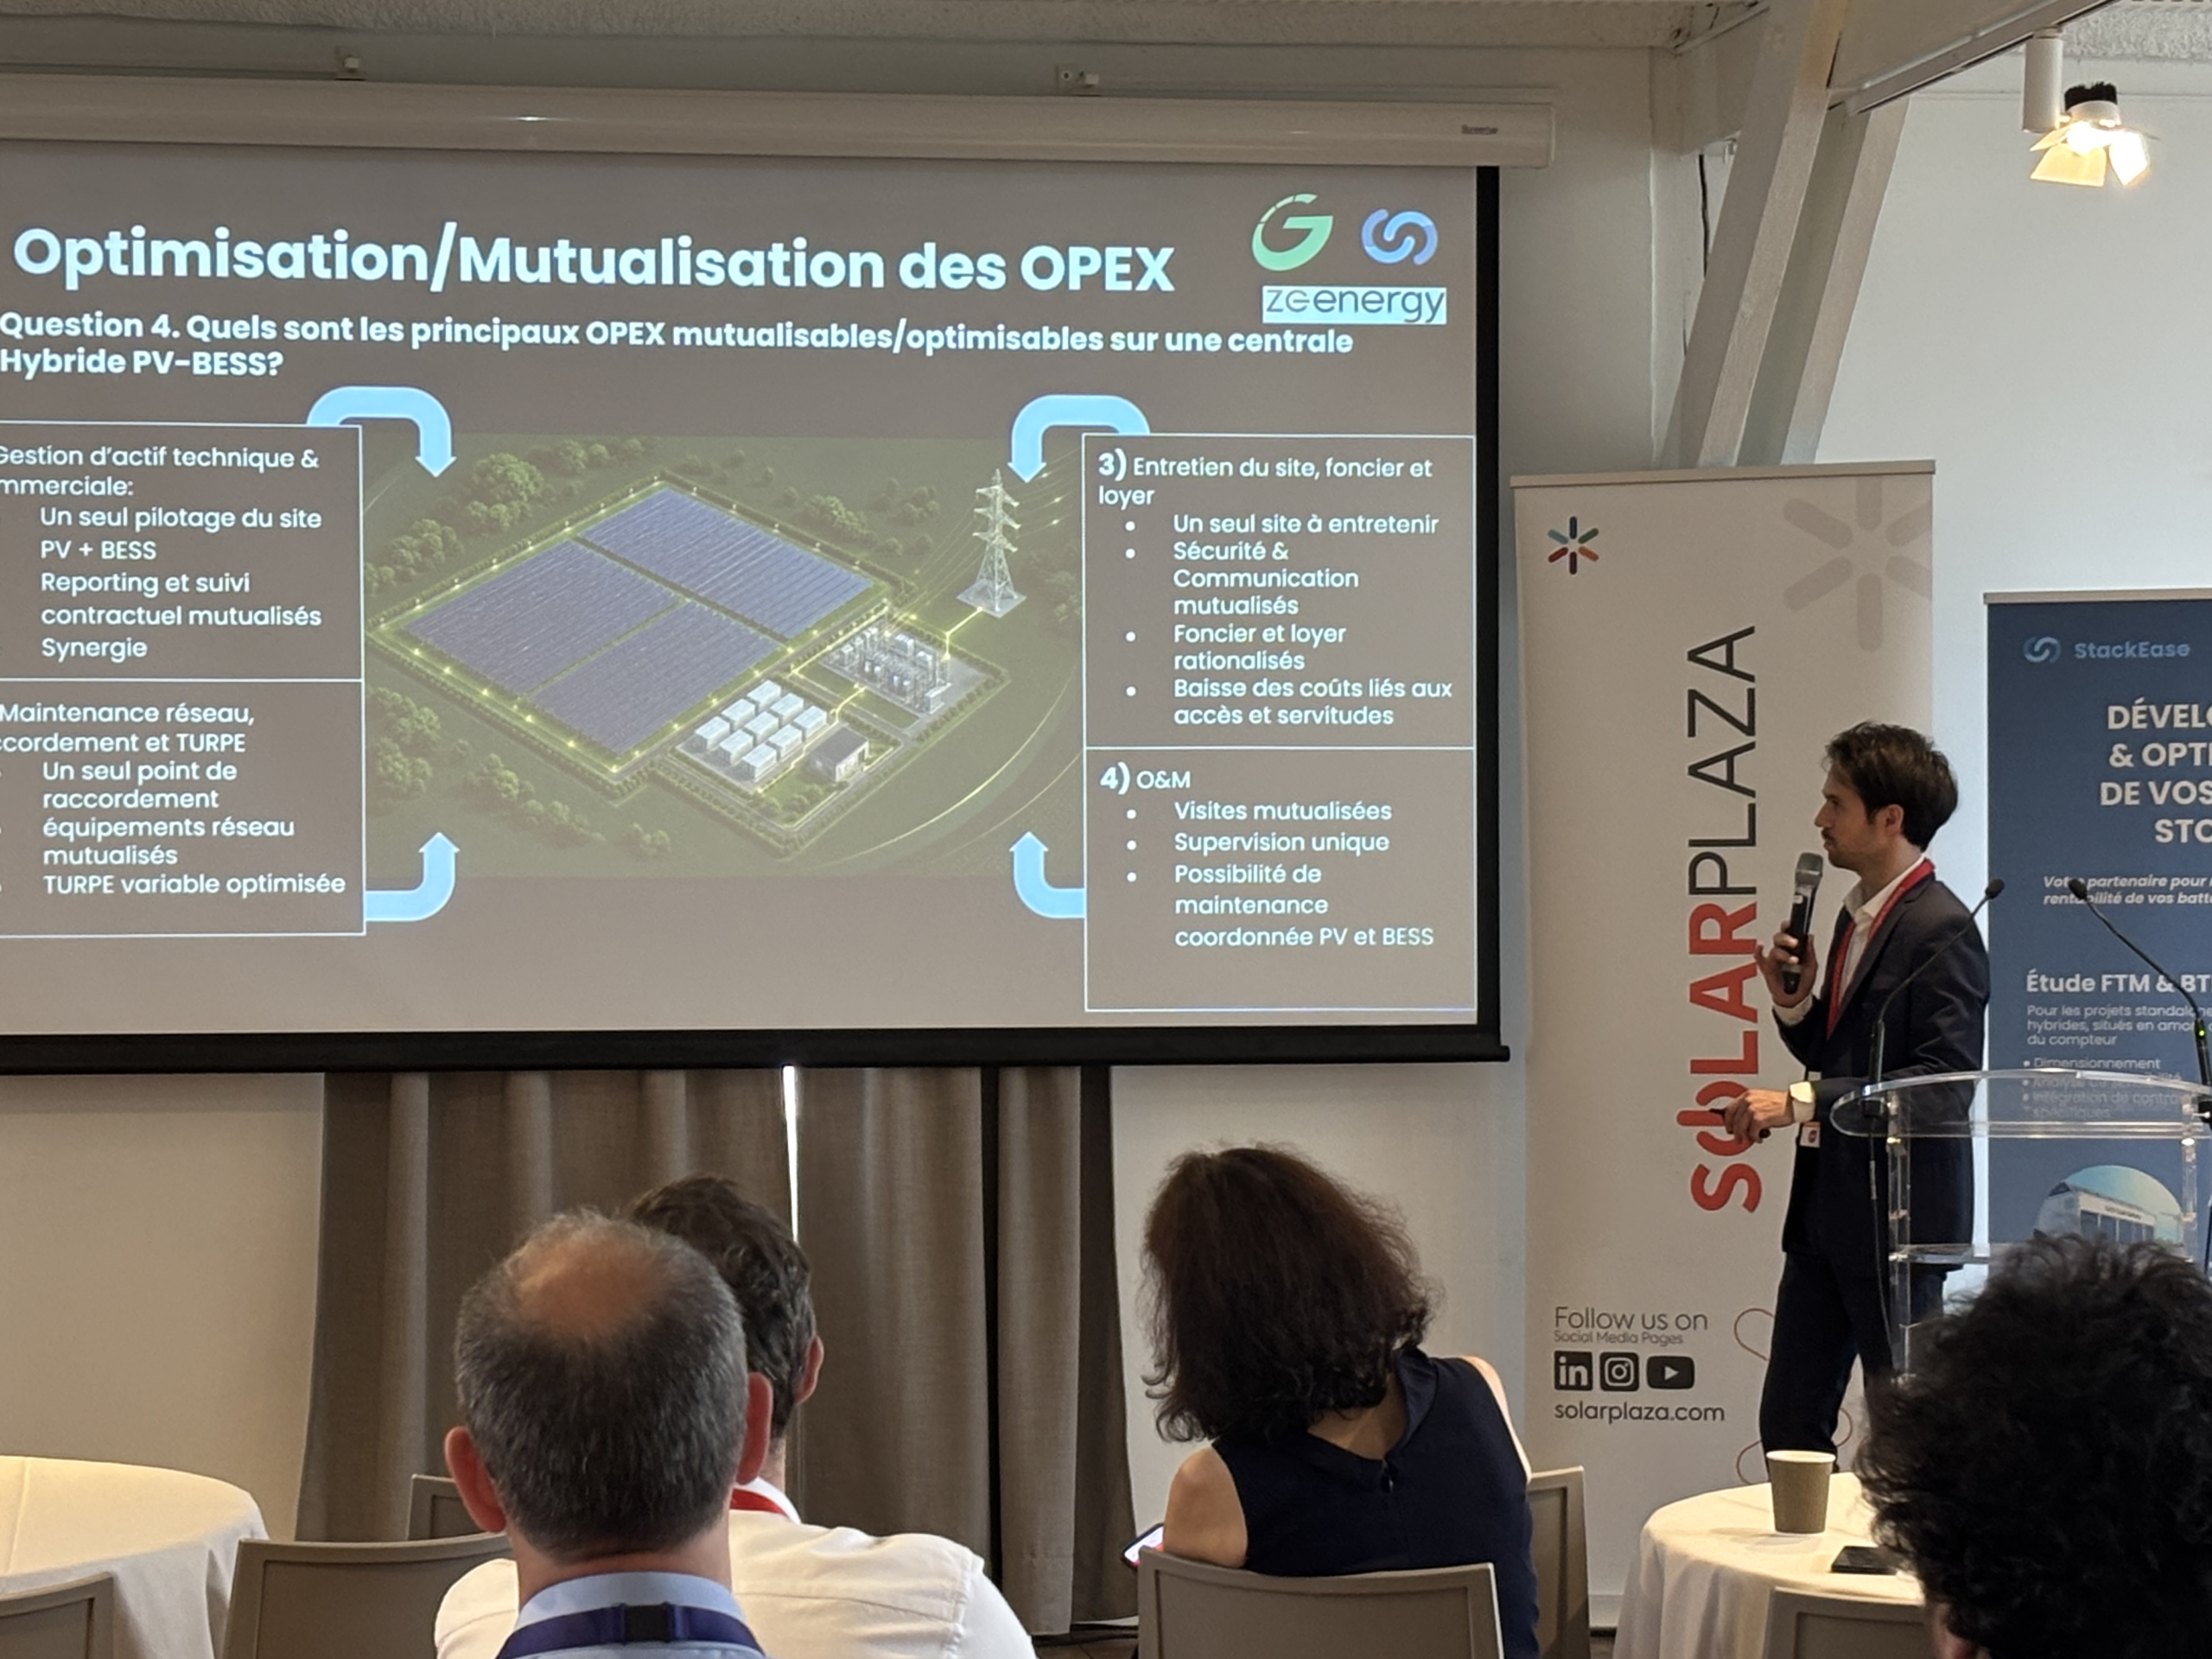
Greensolver at the National Event on “Flexibility in Renewable Energy and Storage” — July 2