
Why the Portfolio Effect Is a Game-Changer in Solar Investment
Summary
- Introduction
- Background
- 1. The portfolio effect is a natural mechanism for reducing risk
- 2. The correlation between sites is the real driving force behind the portfolio effect
- 3. The benefits are measurable and quantifiable
- 4. A practical example: four projects spread across France
- 5. Why banks and investors value the portfolio effect
- Conclusion
Introduction
The European energy market continues to experience structural growth, driven by decarbonisation targets, the increasing electrification of end-use sectors, the growing competitiveness of solar technologies and the quest for greater energy independence. In this environment, investors, developers and financiers are placing increasing importance on the predictability of cash flows and the management of risks that could affect the production and revenue of assets.
One of the main ways of reducing risk is the portfolio effect, also referred to, in the energy sector, as aspillover effect. This mechanism is based on the diversification of a set of assets whose performances are not perfectly correlated. When applied to photovoltaics, we are no longer talking about a single asset of a few MWp, but rather portfolios comprising tens or even hundreds of projects, held by infrastructure funds, IPPs or energy property companies seeking to secure stable income over 20 to 30 years.
Background
The energy performance of a photovoltaic power station depends mainly on the solar irradiance available at the site, but also on factors such as temperature, the technical availability of equipment, electrical losses, soiling, grid constraints and any curtailment. Of these factors, the inter-annual variability of solar resources constitutes an unavoidable source of uncertainty.
Even when a production forecast is carried out in accordance with best practice, using historical meteorological data, detailed technical modelling and conservative assumptions, it cannot completely eliminate the uncertainty associated with future production. This uncertainty is generally represented using probabilistic levels, in particular:
- The P50, which corresponds to a median estimate of production, with a theoretical 50 per cent probability that actual production will exceed this figure;
- The P90, which represents a more conservative estimate, indicating a theoretical 90 per cent probability of being reached or exceeded over the time horizon in question.
The gap between the P50 and the P90 is therefore a key indicator of production risk. It depends, in particular, on the quality of the available data, the length of the meteorological time series, modelling uncertainties and the time horizon analysed.
When an investor assesses an off-grid solar power plant, they remain directly exposed to the specific weather conditions at the site. A year with less sunshine than normal can therefore result in a significant drop in output, turnover and, where applicable, the asset’s ability to meet its financial commitments.
However, this logic changes when several assets are aggregated within a single portfolio. The weather conditions affecting a given power station are never exactly the same as those affecting the other assets. Underperformance at certain sites is therefore partially offset by outperformance elsewhere.
However, the portfolio effect does not result solely from the number of assets held. Its magnitude depends mainly on the degree of correlation between their output. A portfolio comprising numerous power stations concentrated in a single climatic region will offer limited diversification. Conversely, a balanced distribution across several meteorological zones, technologies, orientations, generation profiles and contractual arrangements can significantly reduce the volatility of aggregate generation.
The fundamental benefit of the portfolio effect therefore lies in the reduction in uncertainty at the consolidated level. If the output of the various power stations is imperfectly correlated, the uncertainty of the portfolio increases at a slower rate than its total output. This generally results in a relative convergence between the consolidated P50 and P90 levels, greater visibility on future revenues and, potentially, more favourable financing terms.
The portfolio effect is therefore a key principle of risk management in photovoltaic investment. It does not eliminate climate risk or technical, contractual, regulatory or market risks, but it does help to mitigate their overall impact through a carefully structured and measured diversification strategy. Its value must therefore be assessed through a quantitative analysis of the correlations between assets, and not solely on the basis of the number or cumulative capacity of the power stations held.
In this context, one question keeps cropping up in due diligence processes and investment committees: does increasing the number of projects actually reduce risk, or does it merely shift it and dilute it across a larger volume?
According to Greensolver: yes, the portfolio effect does indeed reduce uncertainty — but only when the portfolio is constructed intelligently, rather than simply being a sum of individual projects.
-
The portfolio effect is a natural mechanism for reducing risk
The first pillar of the portfolio effect is based on a simple statistical principle: the individual performance of solar power stations is not perfectly synchronised. When considered individually, each solar power asset carries its own level of risk linked to the variability of solar resources. This volatility directly results in a dispersion of future generation potential and, consequently, uncertainty regarding the future revenue generated by the installation. A slightly unfavourable year in one region can be offset by a more favourable year in another. Thus, variations in output tend to balance each other out when several assets are grouped together within the same portfolio.
According to the methodology presented by Greensolver, this pooling of risk helps to reduce the overall uncertainty surrounding expected generation and to improve conservative generation levels such as the P90.
For lenders, this results in greater predictability of cash flows. For investors, it reduces the expected volatility of income and improves the overall resilience of the portfolio. This characteristic is particularly relevant in the financing of integrated portfolios comprising numerous assets that are diversified in terms of their nature, location and production profile, thereby demonstrating a controlled risk profile, which is a key factor in value creation.
The portfolio effect thus acts as a genuine mechanism for reducing generation risk, without requiring any technical modifications to the assets in question.
-
The correlation between sites is the real driving force behind the portfolio effect
The portfolio effect does not depend solely on the number of power stations in the portfolio. The key factor remains the degree of correlation between the various assets.
Correlation measures the extent to which the output of two power stations follows a similar pattern. When two sites consistently experience the same weather conditions, their correlation is high. Conversely, when conditions regularly differ, the correlation decreases and the portfolio effect becomes more favourable.
Several factors influence this level of correlation:
- Geographical proximity
- Climate
- Large-scale weather phenomena
- Technical and operational correlations
Thus, two power stations located just a few kilometres apart may exhibit extremely high levels of correlation – sometimes exceeding 95 per cent – due to virtually identical weather conditions. Conversely, two power stations situated several hundred kilometres apart may exhibit much more independent behaviour.
This is of major importance to developers seeking to maximise the value of their platforms.
A portfolio concentrated in a single geographical area may have a high level of installed capacity whilst benefiting from a limited portfolio effect. Conversely, a more geographically diversified portfolio may offer a significantly greater reduction in risk despite having a comparable level of installed capacity.
The quality of diversification is therefore often more important than the gross size of the portfolio.
-
The benefits are measurable and quantifiable
One of the key advantages of the portfolio effect is that it can be objectively measured.
This is not based on a qualitative assessment but on a rigorous statistical calculation incorporating:
- The uncertainty inherent in every project;
- The relative weight of each asset in the portfolio;
- The correlation coefficients observed between the various sites.
The variance-covariance formula used by Greensolver thus enables the calculation of an aggregate uncertainty at portfolio level.
This approach offers a considerable advantage to funders, as it allows the benefits of diversification to be directly reflected in financial models.
The lower the correlation coefficients, the greater the reduction in uncertainty.
The portfolio therefore benefits from a direct improvement in its conservative production levels.
This improvement is particularly relevant in the context of sensitivity analyses carried out by banks, credit rating agencies or institutional investors.
The work carried out as part of the due diligence process shows that this approach generally leads to a gradual improvement in conservative indicators as the number of projects increases:
- Portfolio of 1 project: P50–P90 standard deviation of 6 to 9 per cent;
- Portfolio of 50 projects: standard deviation (P50–P90) for the portfolio ranging from 5.5% to 7.5%;
- Portfolio of 100 projects: standard deviation (P50–P90) for the portfolio is 4–6.5 per cent;
- Portfolio of 400 projects: standard deviation (P50–P90) for the portfolio ranging from 3.5 per cent to 5.5 per cent.
These figures depend on the nature and location of the power stations, but they clearly illustrate the trend: the larger and more diversified the portfolio, the lower the relative uncertainty.
For a financier, this improvement translates directly into greater clarity regarding future cash flows. For an investor, it increases the overall resilience of income.
-
A practical example: four projects spread across France
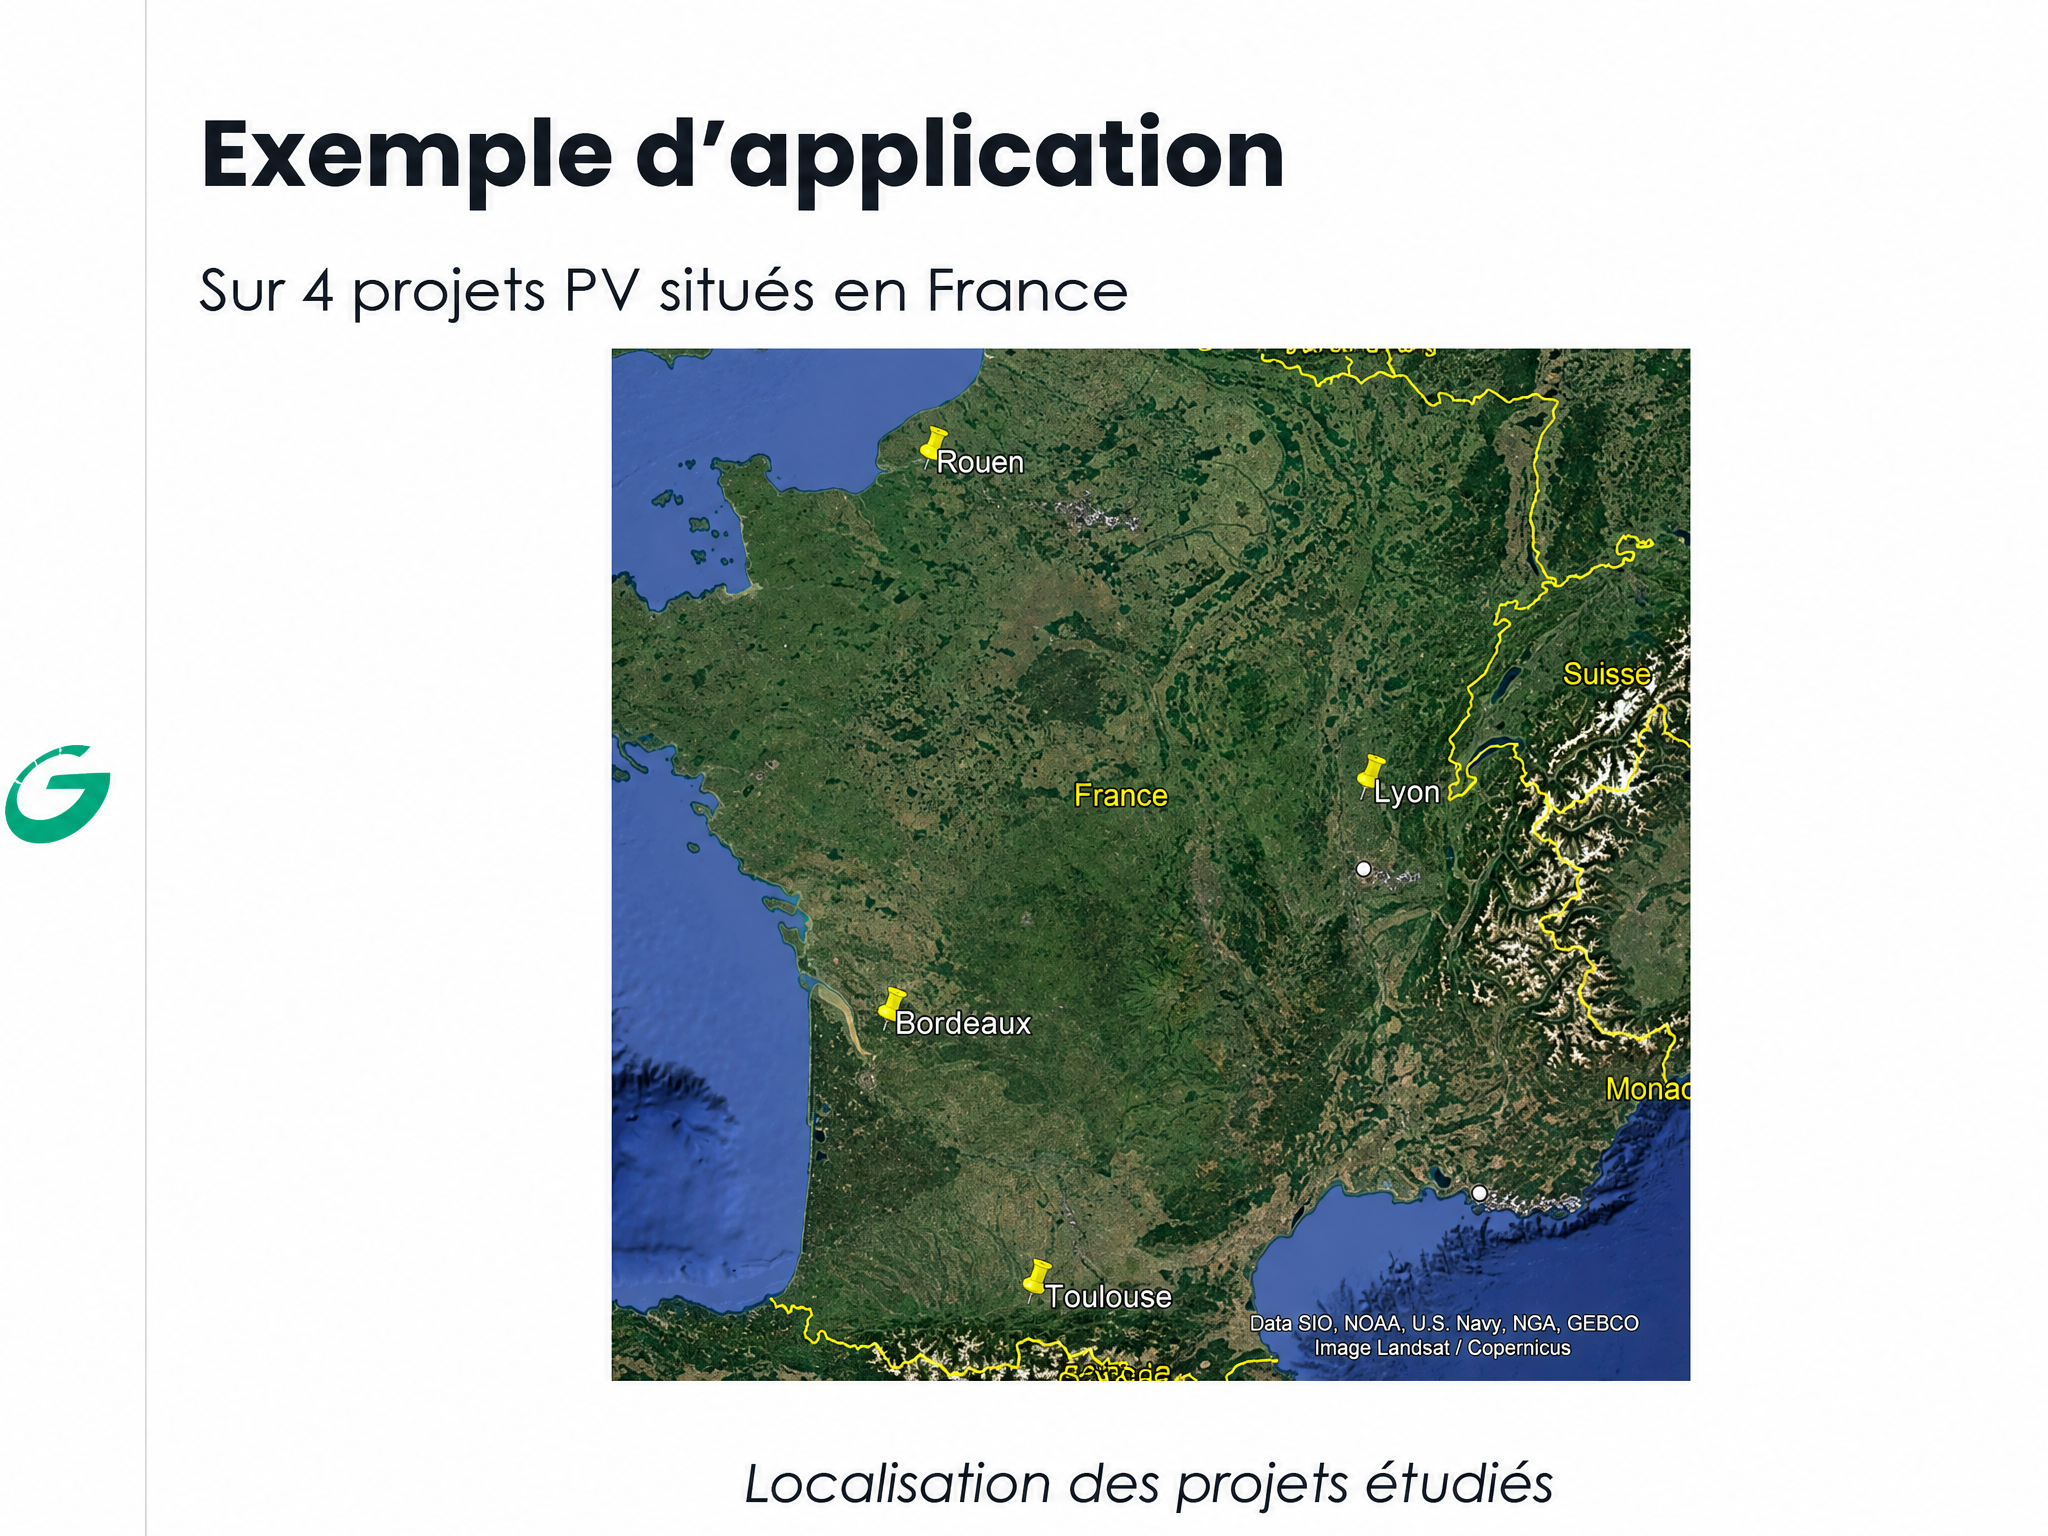
The approach presented was illustrated using a portfolio comprising four photovoltaic projects located in Toulouse, Bordeaux, Rouen and Lyon.
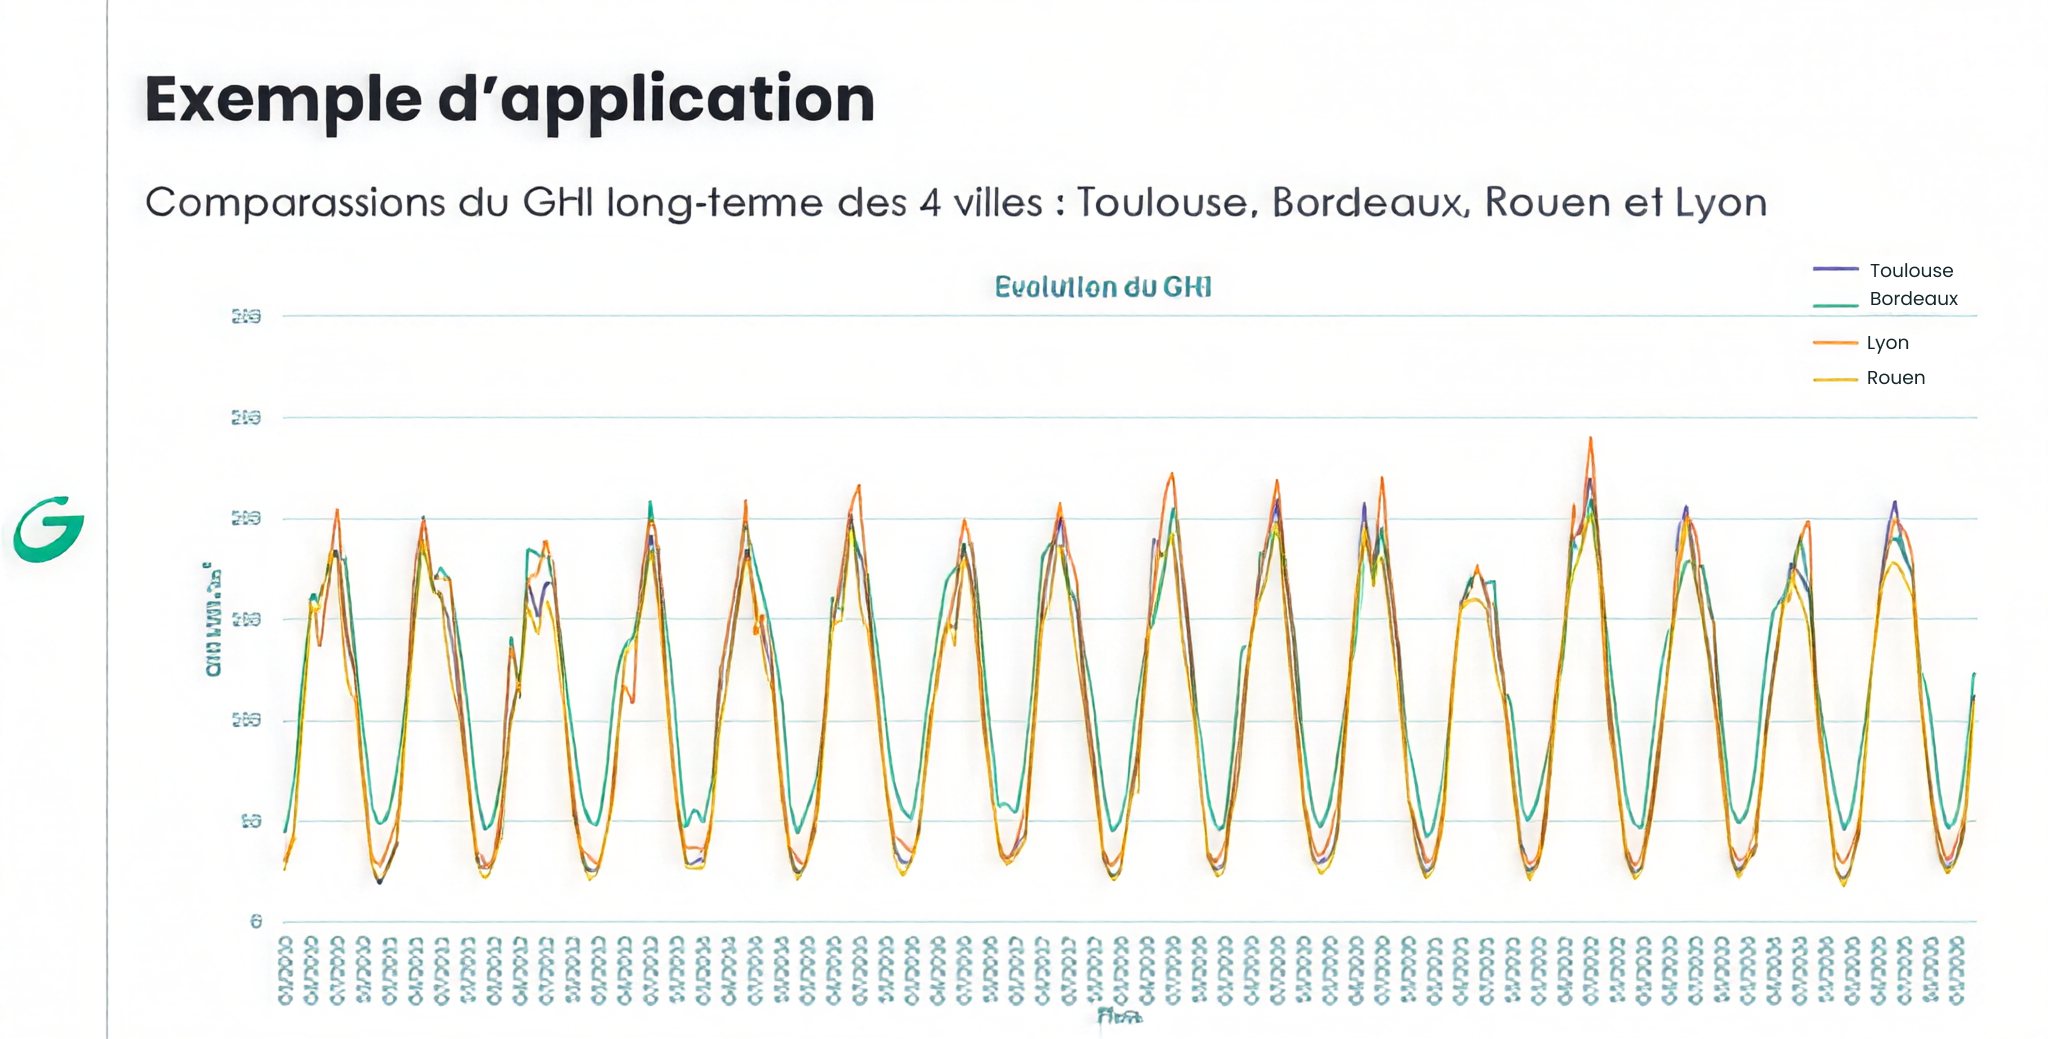
The analysis shows that the radiation profiles follow a similar pattern, though not exactly the same, across these different cities.
The correlation coefficients calculated remain high, ranging from 0.955 to 0.985 depending on the pairs of sites studied. Despite this strong correlation, the portfolio effect remains present because the behaviours are not perfectly synchronised.
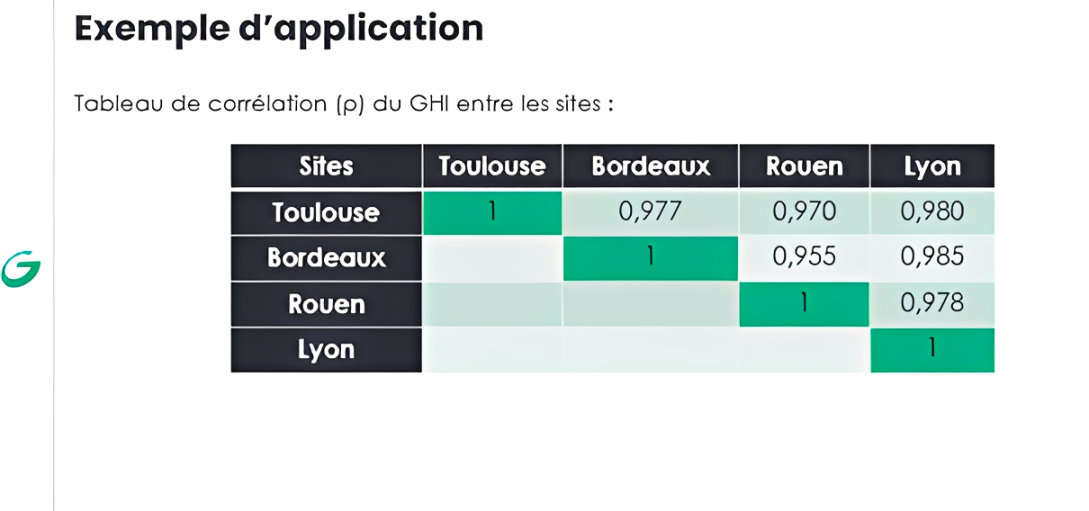
The conclusion of this study is particularly interesting: even within a relatively homogeneous country such as France, geographical dispersion already allows for a partial pooling of risk. Variations in radiation exposure do not occur at exactly the same time or with the same intensity at every site, which helps to reduce the uncertainty of the overall portfolio.
-
Why banks and investors value the portfolio effect
For an investor or lender, the true measure of the portfolio effect’s significance lies in its impact on financial assumptions.
The aggregate uncertainty calculated at portfolio level is directly incorporated into the calculation of conservative indicators such as the portfolio P90.
However, the P90 is generally taken as the benchmark for:
- Credit scenarios;
- Setting minimum DSCR levels;
- The scale of the debt;
- Investors’ downside analyses;
- Technical reviews carried out as part of the procurement process.
A portfolio that benefits from a favourable diversification effect therefore automatically has a more robust risk profile.
For lenders, this can provide greater clarity regarding future cash flow generation.
For investors, this translates into an improved risk-return profile and a reduction in the expected volatility of income.
In some cases, this improvement may have a direct impact on a platform’s financing terms or its overall valuation.
The portfolio effect thus becomes much more than a mere statistical concept: it is a genuine driver of value creation.
Conclusion
The analysis clearly confirms the initial hypothesis: the portfolio effect is an effective means of reducing risk in photovoltaic portfolios. Thanks to geographical diversification and the imperfect correlation between sites, variations in generation tend to partially offset one another. This results in a reduction in the overall uncertainty of expected generation, an improvement in conservative indicators such as the P90, and greater visibility regarding future revenues.
A mix combining ground-mounted PV, agrivoltaics, wind power and battery energy storage systems (BESS) is not merely a diversification of generation: it is a diversification of regulatory risks (separate CRE tenders), market risks (CRE PPE2 contracts, PPAs) and commissioning risks. A portfolio in which not all projects reach their COD date in the same year, and not all depend on the same buyer or the same tariff, is better able to withstand a one-off shock — such as a delay in connection by Enedis, a tariff review or market price volatility — without jeopardising the entire financing structure.
This is precisely the challenge we tackle at Greensolver, through our financial modelling, business plan audit and technical lending advisory services for multi-technology portfolios. If you are structuring or financing a solar, BESS or hybrid portfolio, please do not hesitate to contact us to discuss it.
Written by Andréa Nut