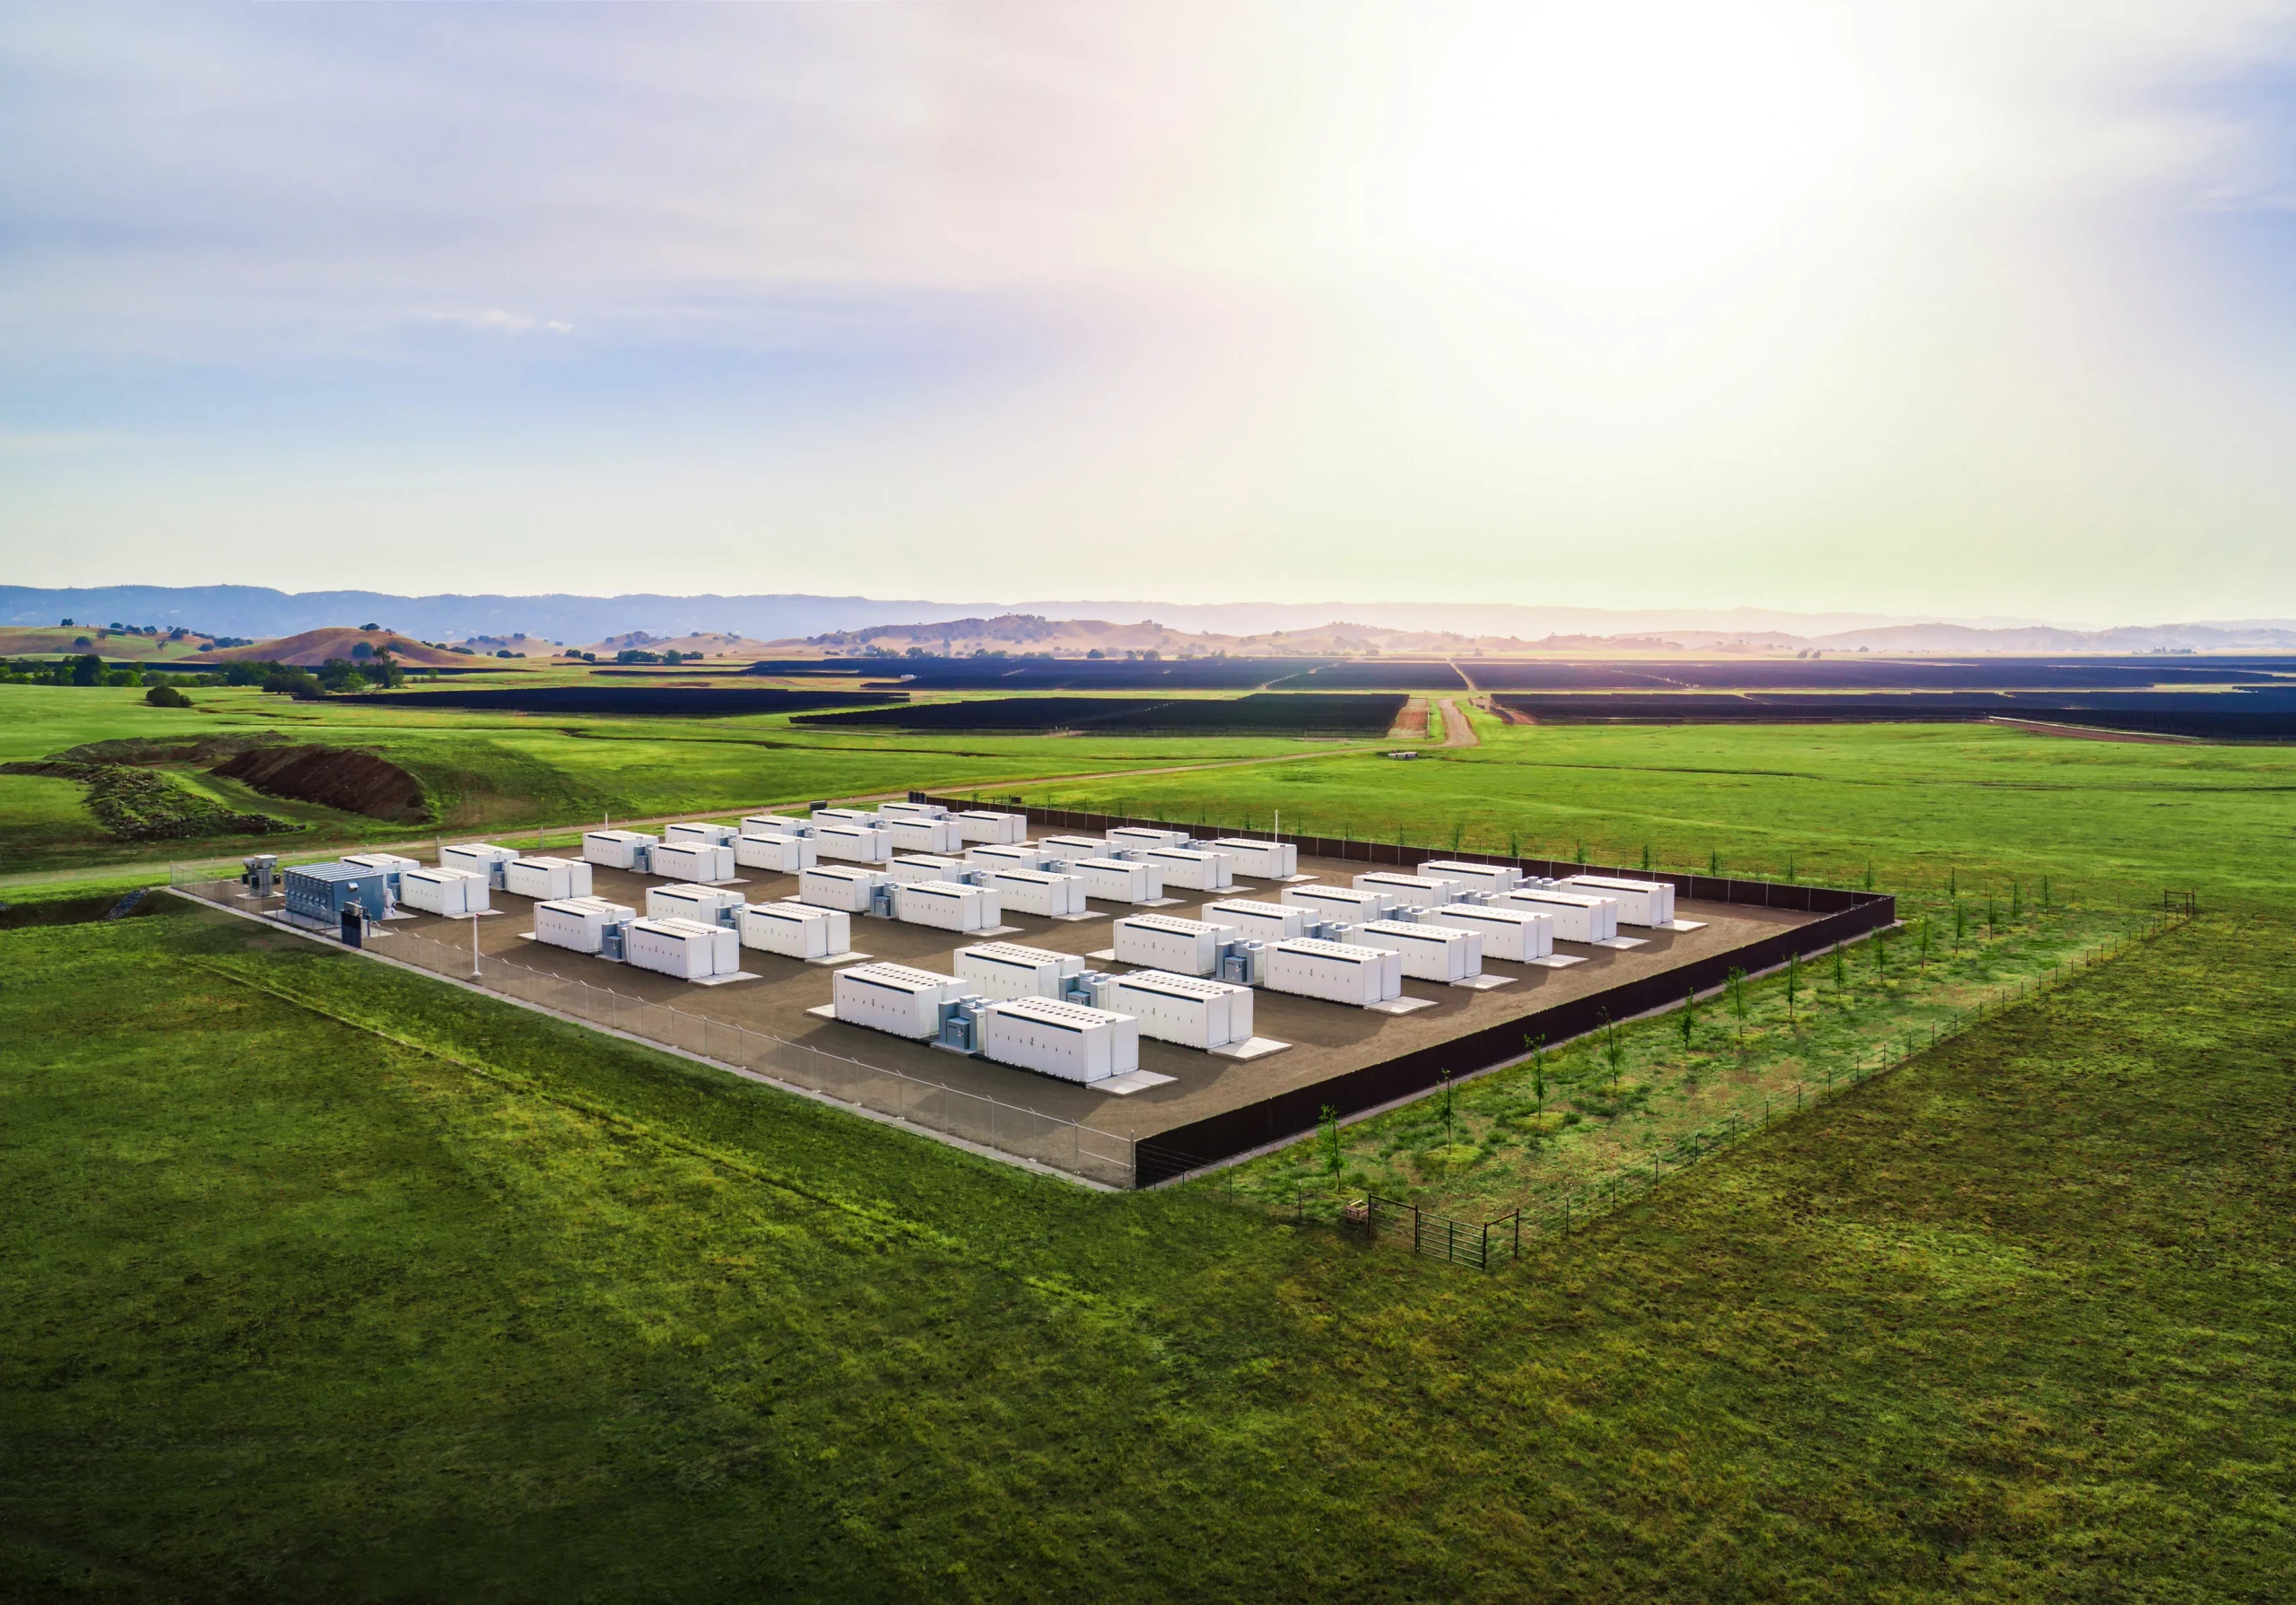
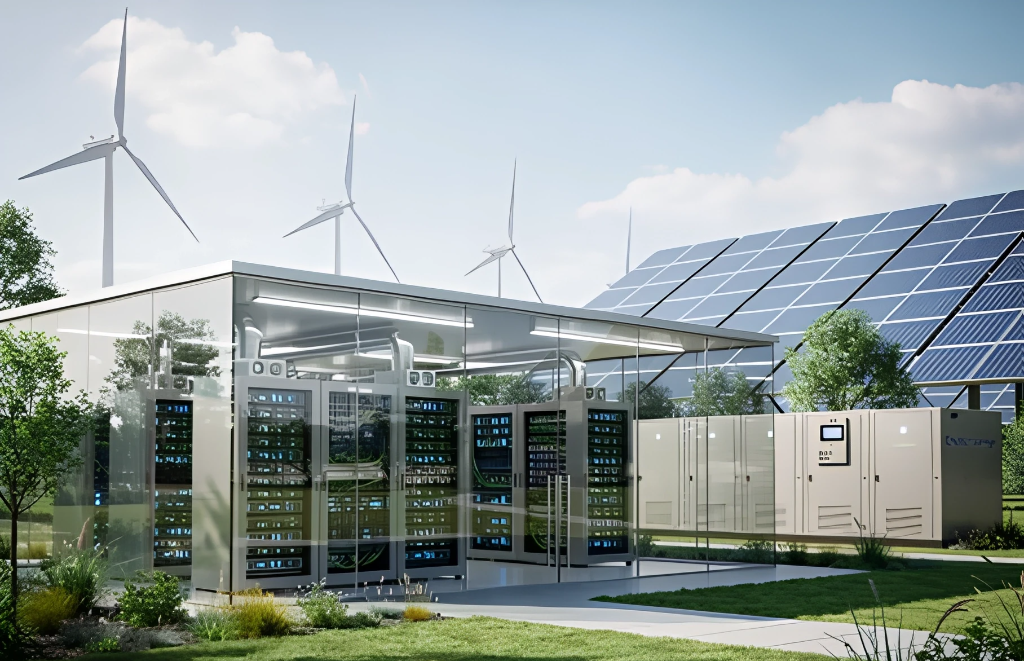
Bess
19 mars 2026
Conseil technique
et gestionnaire d’actifs
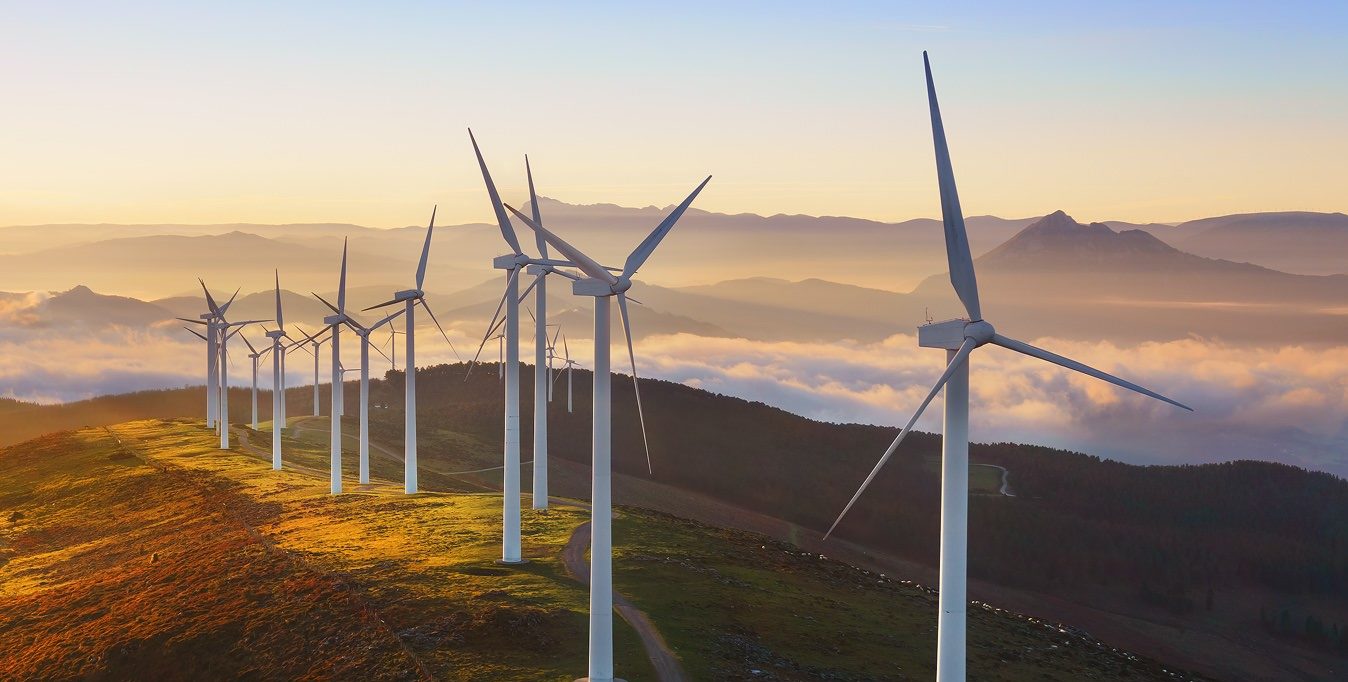
62 GW éolien, solaire et BESS
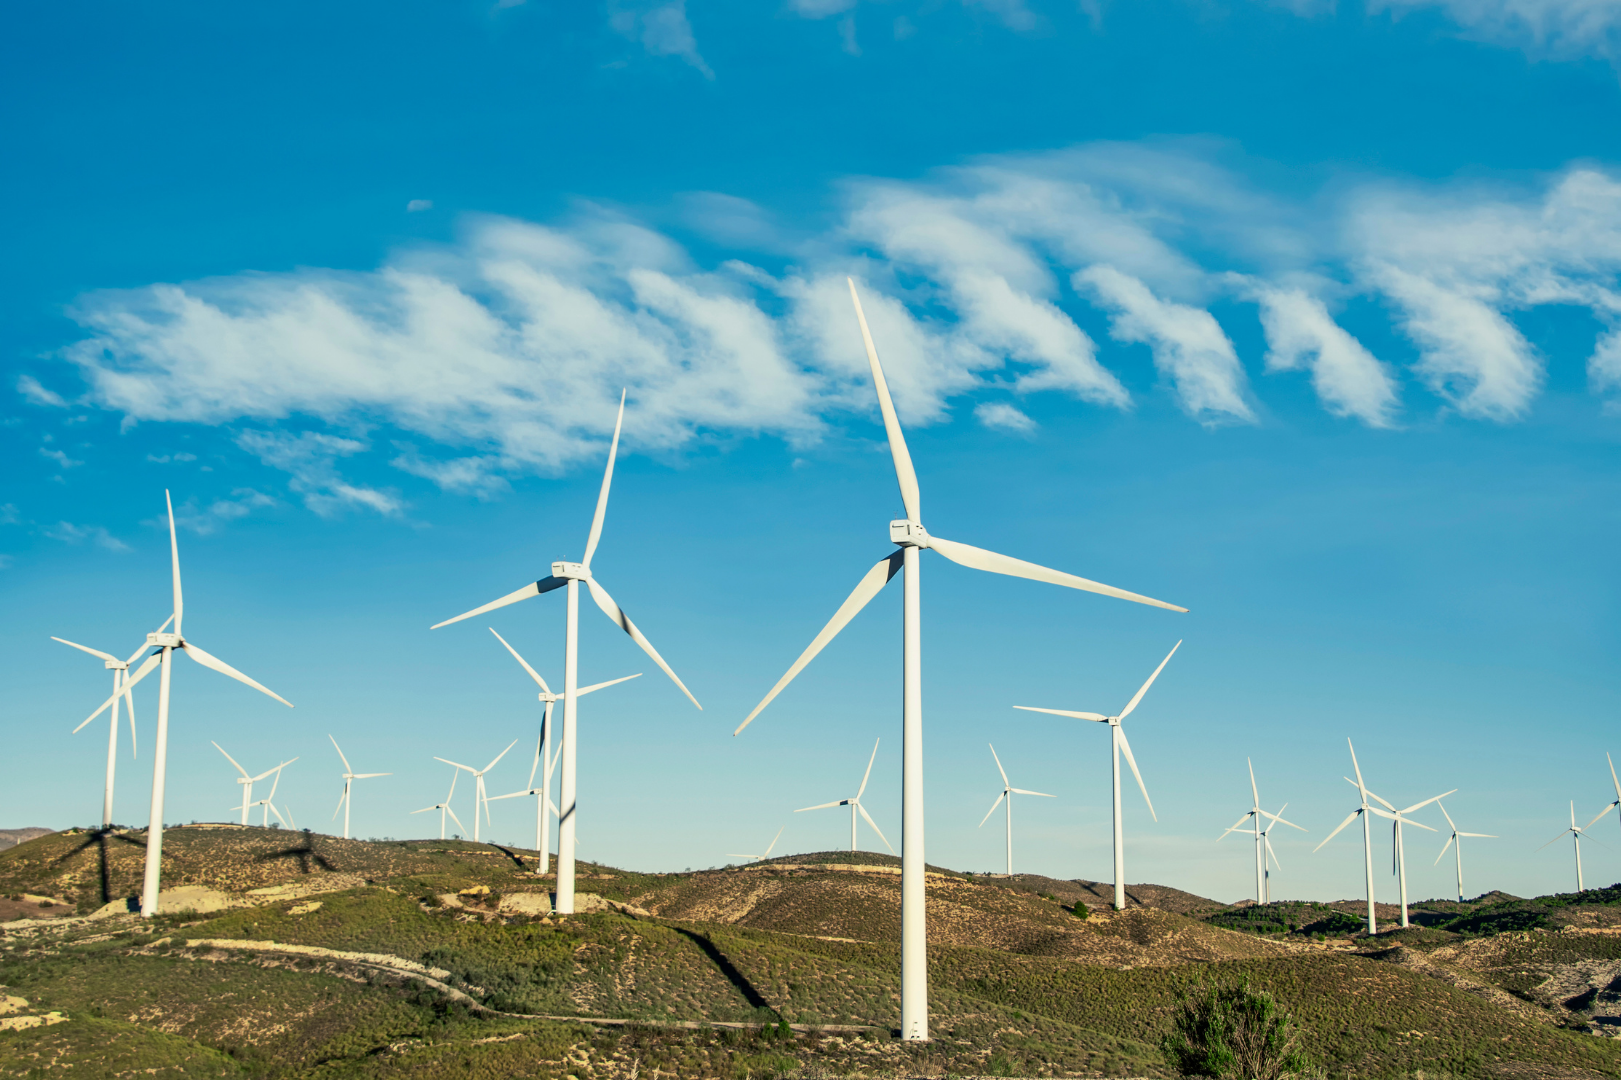
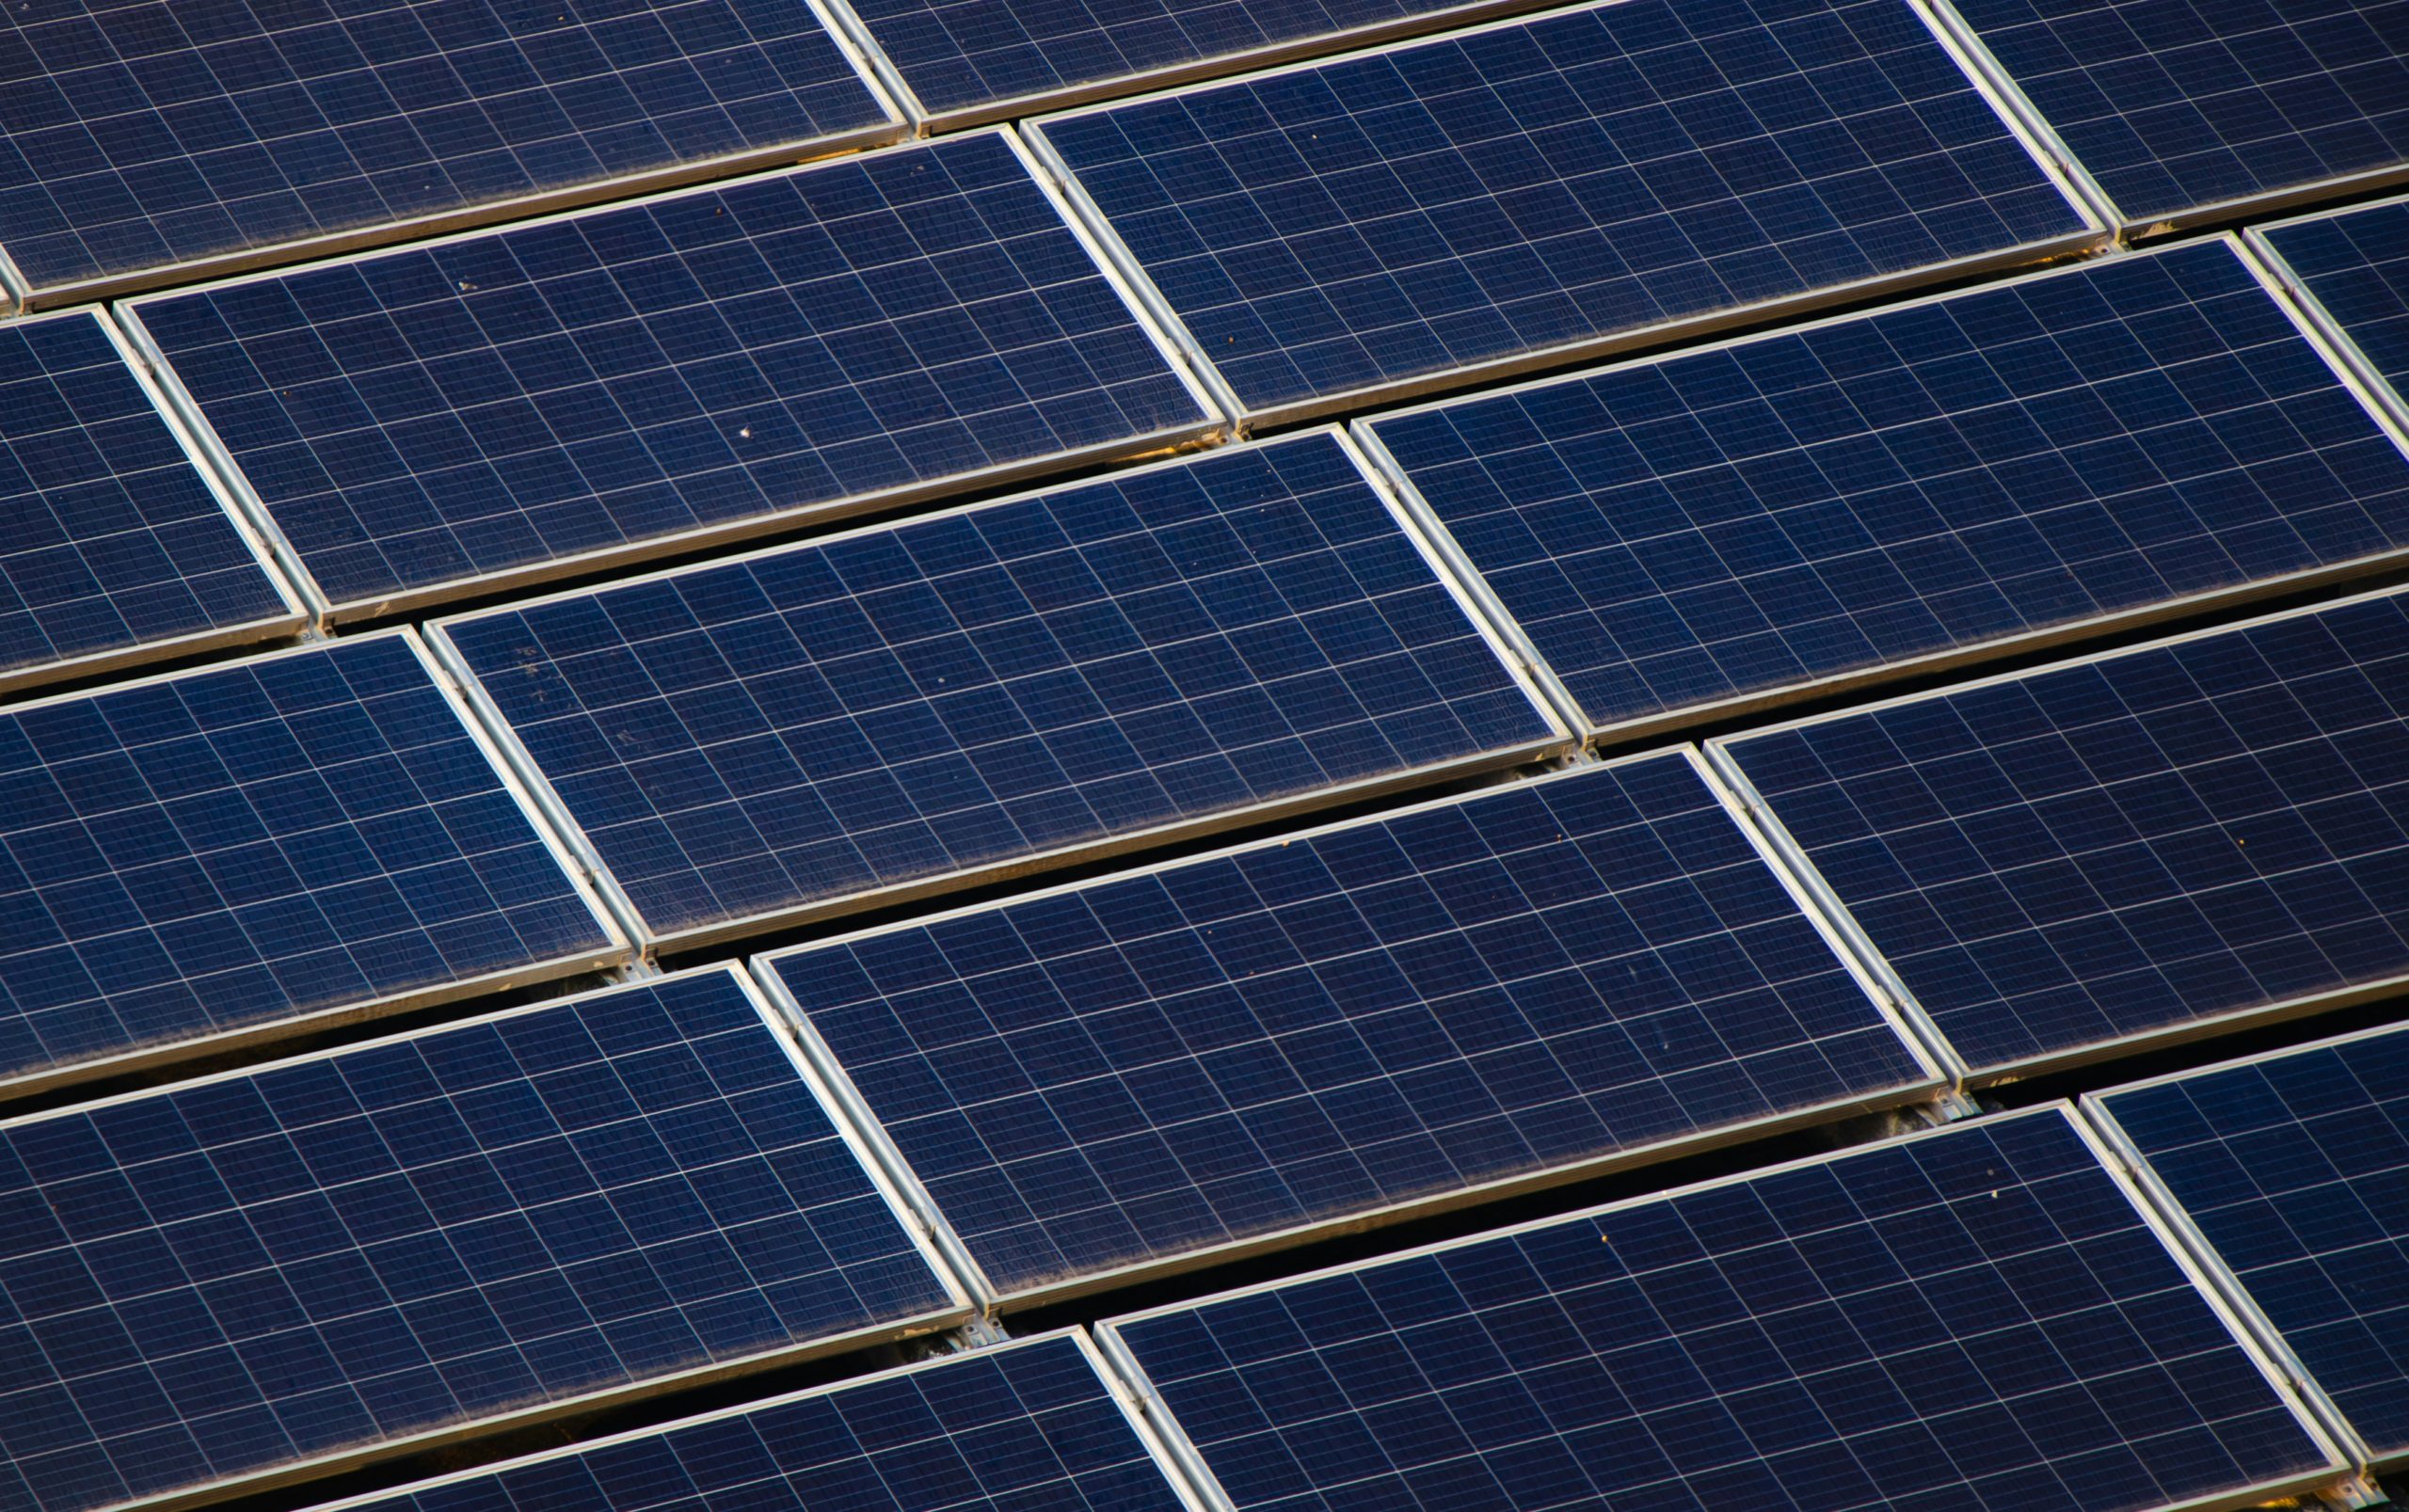
Greensolver est un conseil technique et gestionnaire d’actifs européen de premier plan, fort de 20 ans d’expérience et d’un portefeuille de 62 GW. Nous accompagnons les prêteurs, les investisseurs et les propriétaires d’actifs dans leurs projets d’énergie renouvelable à chaque étape, du développement à la construction, l’exploitation et le repowering. Nous travaillons dans les domaines de l’énergie solaire, éolienne et des systèmes de stockage d’énergie par batterie (BESS).
Technique & Finance : Une approche intégrée
Greensolver combine une expertise technique en ingénierie avec une analyse financière et opérationnelle afin de soutenir à la fois les activités de conseil et de gestion d’actifs.
Nos équipes collaborent entre différentes disciplines afin de garantir que les conclusions techniques (du rendement énergétique et des performances des équipements au comportement du réseau et aux pratiques d’exploitation et de maintenance) soient directement liées à leurs impacts financiers et opérationnels.
Cette approche intégrée renforce le conseil en matière de transactions, améliore la précision du financement des projets et, au final, maximise la valeur des projets d’énergie renouvelable tout au long de leur cycle de vie.
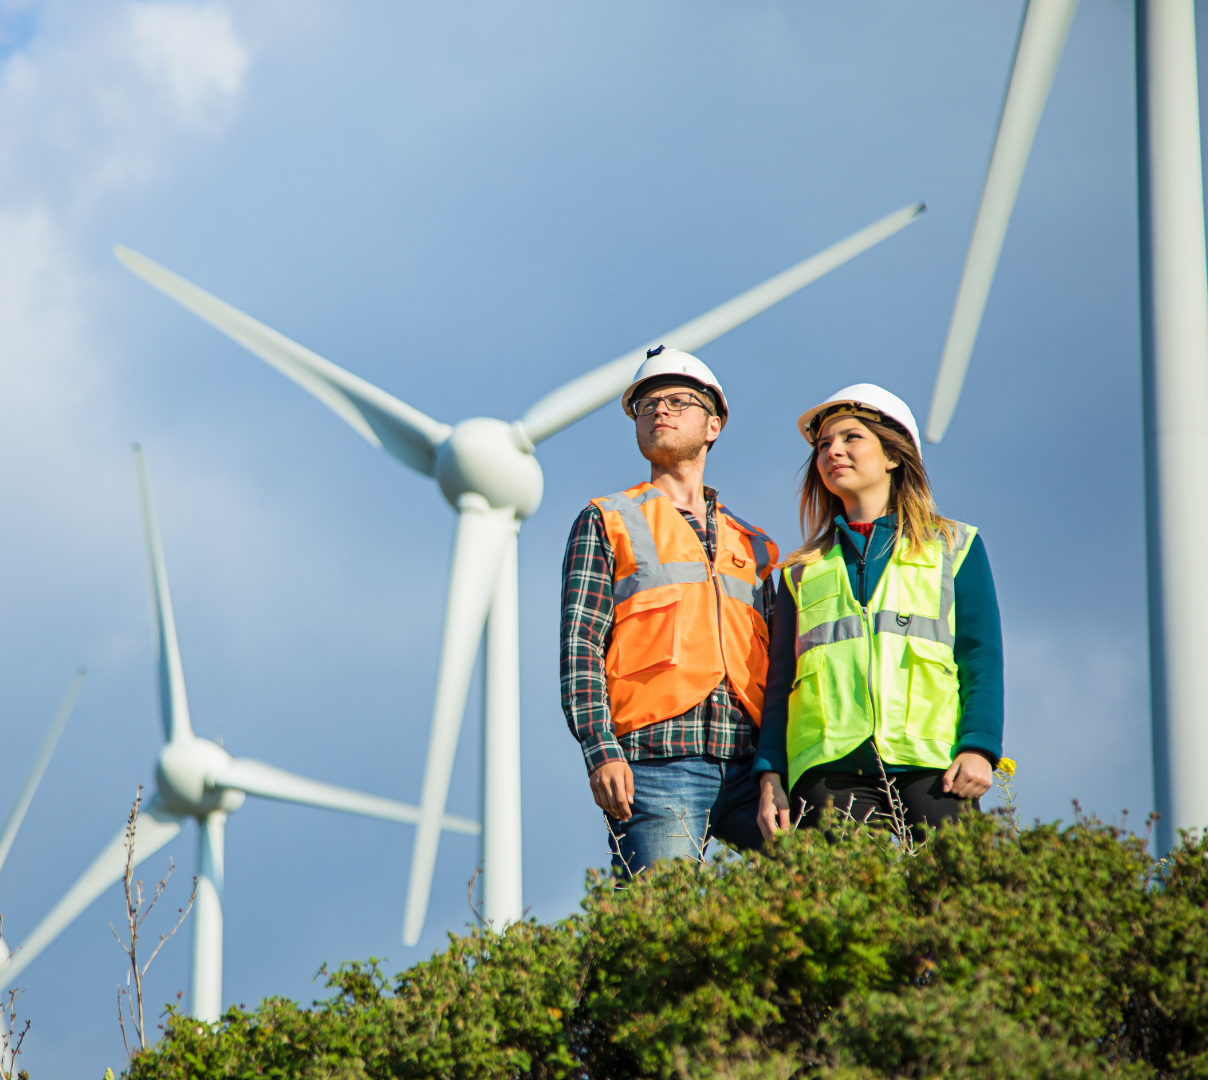
Un Partenaire, 2 Services :
Conseil et Gestion d’Actifs
Assurez la réussite de votre projet, depuis les premières étapes jusqu’au repowering. Nos services de conseil combinent expertise technique et financière pour vous guider dans vos décisions cruciales, que vous développiez, financiez, acquériez, vendiez ou optimisiez des actifs renouvelables. Nous réalisons des audits techniques et des modélisations financières de qualité premium. Les équipes locales de Greensolver bénéficient du support des équipes techniques internationales pour réaliser des missions de conseils à haute valeur ajoutée.
Optimisez la valeur de vos actifs grâce à une gestion certifiée ISO 55001. Nos équipes fournissent des solutions de gestion technique et financière dans toute l’Europe afin de garantir l’intégrité et maximiser la rentabilité de votre portefeuille d’actifs éoliens, solaires et de stockage.
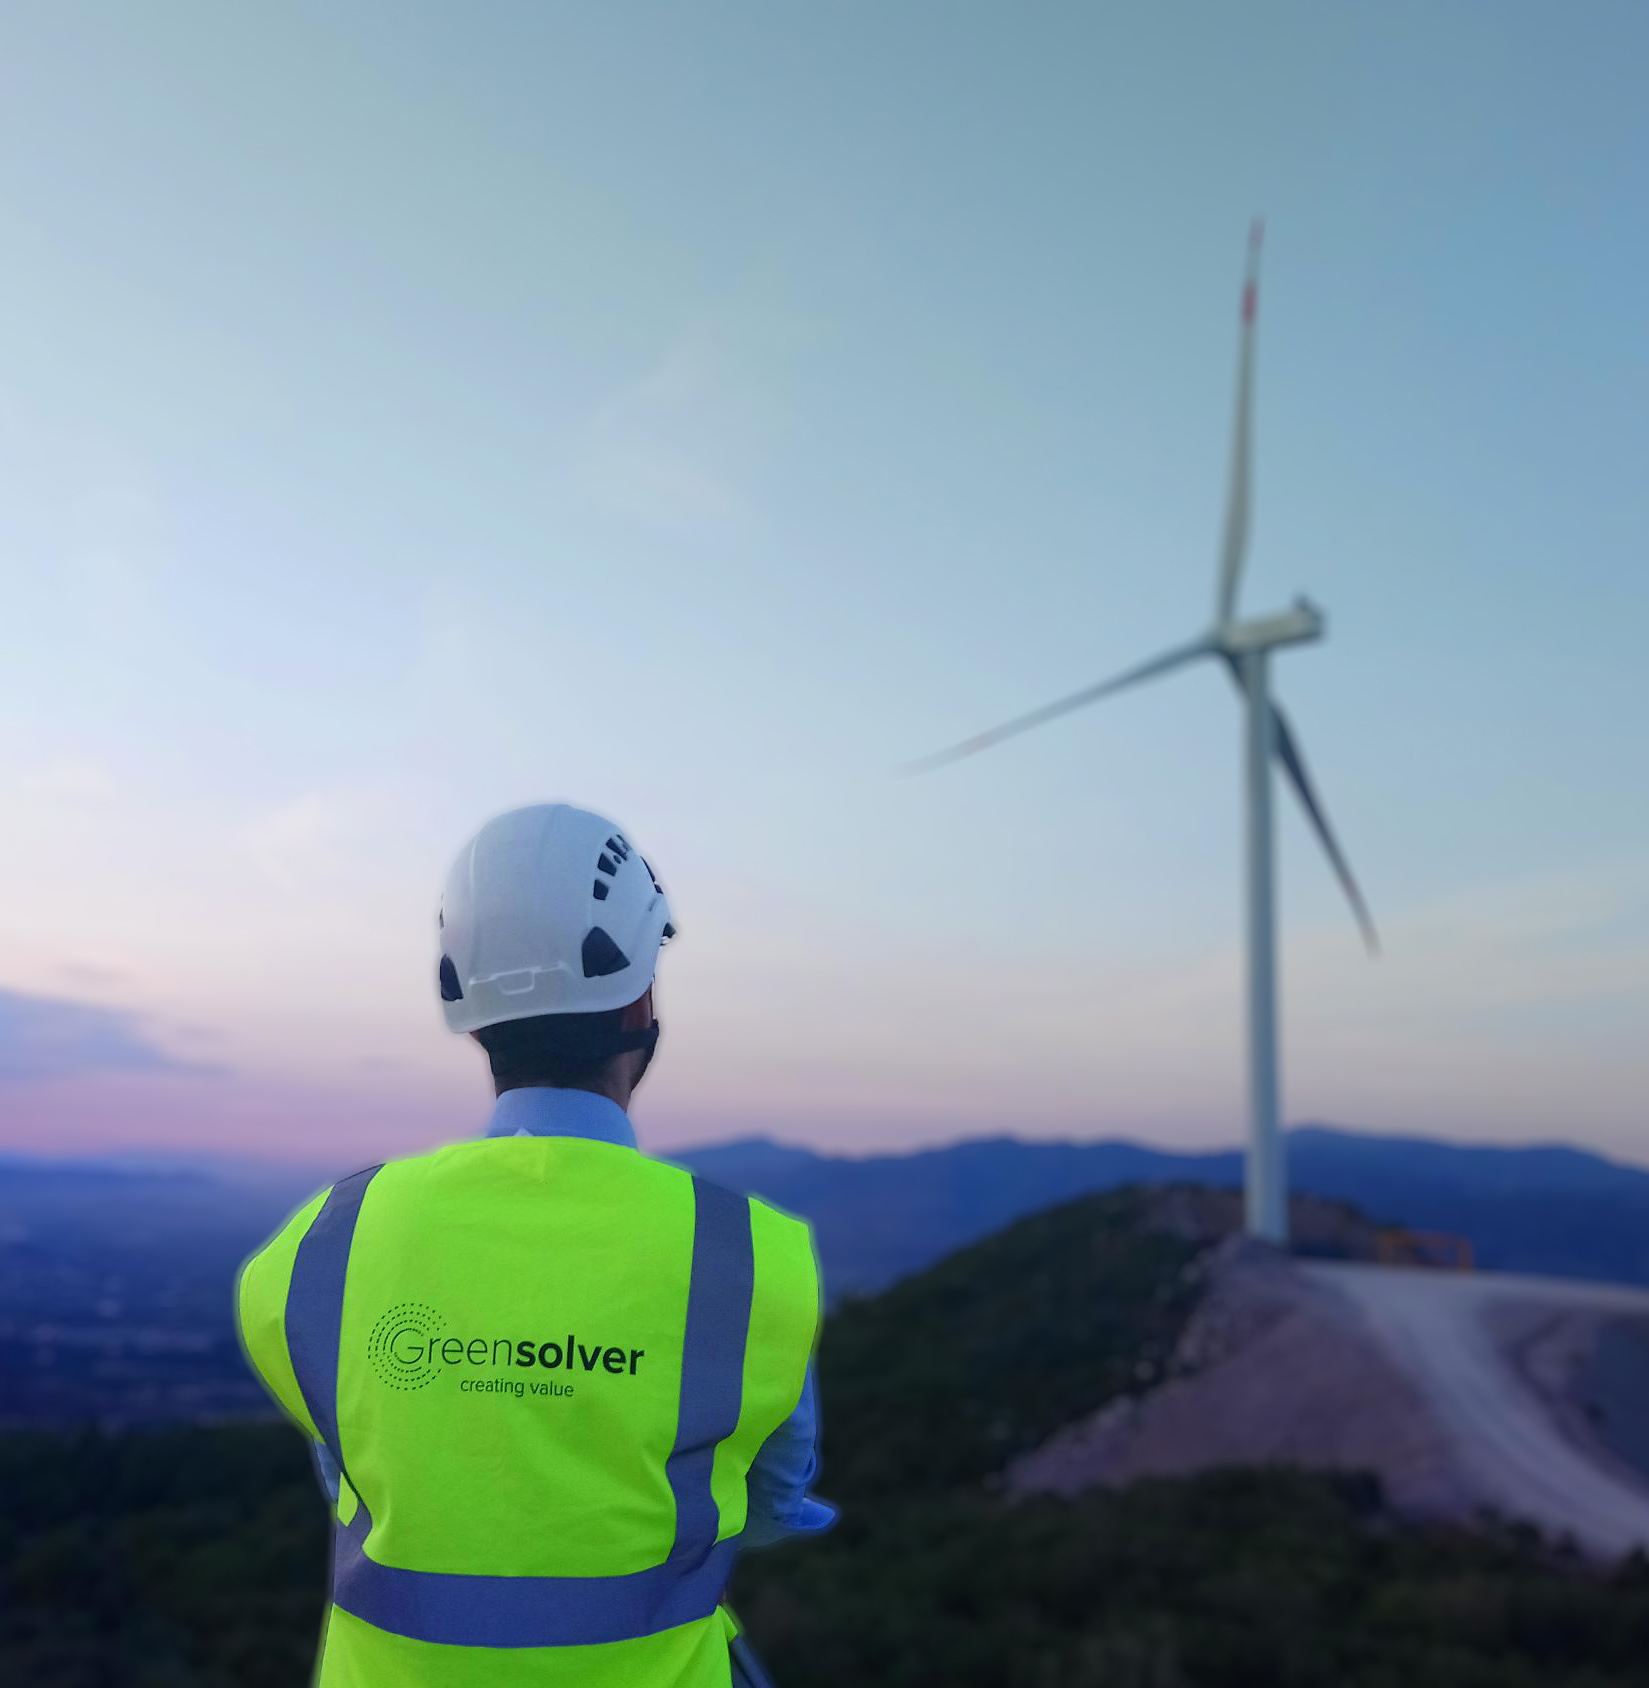
Votre partenaire de confiance


Aller plus loin
Suivez les nouveautés
Contactez nous