Evaluating Maintenance Performance
Evaluating Maintenance Performance
The profitability of wind farms is often compromised by turbine failure and downtime. Despite the wide variety of preventative maintenance programs which are often implemented across these farms, failures can still occur.
Seeking to help investors minimize the occurrence of lengthy downtime as a result of these failures, Greensolver conducted a survey on production loss. The study collected data from 20 operating parks, totalling around 200MW, over a two-year period, from the beginning of 2013 to the end of 2014. The study looked at three turbine manufacturers and eight varieties of turbine model in order to identify the profitability of wind farms.
From this study, we surmised that around 8,076MWh was lost over the two-year time period. This figure represented around 1.2% of the parks’ total global production. Converting these figures into monetary terms, a total of €720,000 of potential income was lost. Greensolver was keen to establish the major contributing factors to this level of production loss.
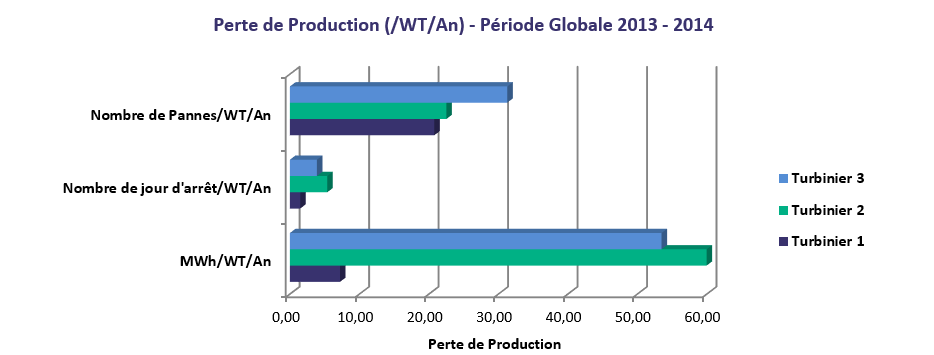
From Figure 1 it is clear that there is a direct correlation between the average downtime of different manufacturers’ turbines and the production loss from farms using each manufacturer’s turbines. Farms using Manufacturer 2 experienced the greatest overall downtime and the most significant production loss.
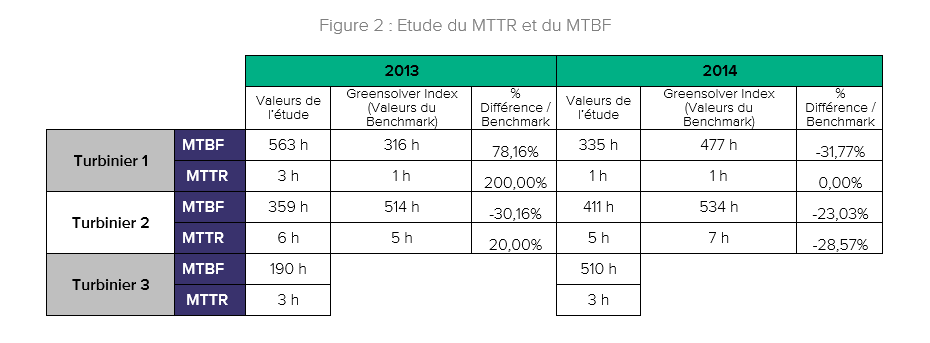
Figure 2 shows that Manufacturer 2 is also the manufacturer with the greatest Mean Time To Repair (MTTR); twice as long as the other manufacturers in 2013, and five times as long in 2014. Clearly, when a turbine produced by Manufacturer 2 experiences a failure, the resulting downtime is much longer for that turbine than for others, resulting in a greater production loss for the farm using that turbine.
Indeed, Figure 1 would suggest that it is not the frequency of downtime occurrences which is the main factor for production loss but the duration of each downtime occurrence. So for example, Manufacturer 1 experienced downtime almost as often as Manufacturer 2, but its total production loss was five times less. Similarly, there were significantly more breakdowns for Manufacturer 3 than for Manufacturer 2, yet its total production loss was much smaller.
Based on this study, Mean Time Between Failure (MTBF) and Mean Time To Repair (MTTR) appear to be the crucial factors developers should consider when choosing a manufacturer and/or maintenance provider (if they aren’t one and the same).
Of course, the performance of local maintenance teams is likely to have more impact on MTBF and MTTR than the design of the wind turbine or its maintenance provider. Yet our study would suggest that manufacturers and maintenance providers do play a role, particularly when we consider the consistency at which Manufacturer 2 underperformed comparative to Manufacturer 1 and 3.
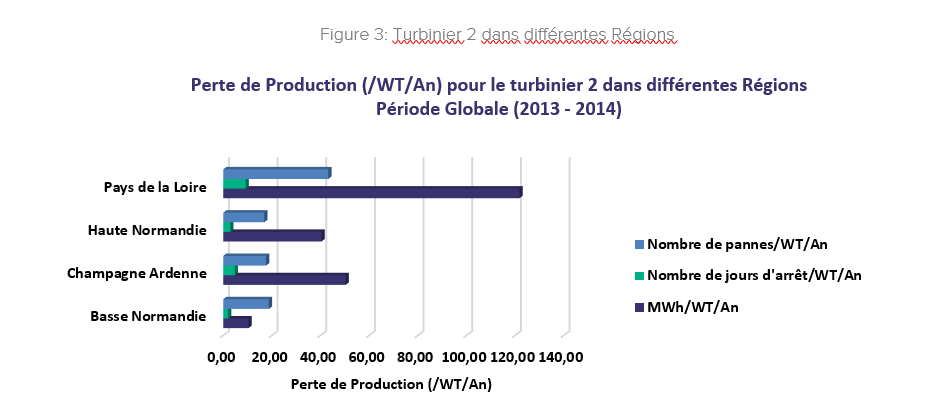
If we look at Manufacturer 2 in more detail, however, we can see that there are significant differences between its various maintenance centers (as shown in Figure 3). The relationship between failures and production loss varies widely depending on the region; the ratio of failures to production loss is ten times higher in Pays de la Loire than in Basse-Normandie. This would suggest that the local maintenance team in Basse-Normandie is much more efficient when it comes to fixing failures, resulting in less downtime and consequently smaller production losses.
This suggests that developers should take their assets’ location into account, and consider which manufacturer or maintenance provider is most suitable for that particular region.
The Greensolver Index provides Greensolver with the most recent data, such as that collected in the study above. This allows improvement plans to be put in place should they be required. For example, Greensolver is currently in conversation with Manufacturer 2 about how they might improve MTTR across their regional maintenance centres. With 8 years of asset management experience, Greensolver are well placed to advise on such issues, and know where to look when it comes to pinpointing production loss factors.
The Latest Renewable Energy News
Webinar Replay – Modeling the Economic Potential of BESS: How to Manage Uncertainty | June 17, 2:00 p.m. CET

Greensolver will be attending the 12th GreenUnivers Infrastructure Financing Conference on July 1
Greensolver at the National Event on “Flexibility in Renewable Energy and Storage” — July 2