Solar Panel Degradation Rates
Solar Panel Degradation Rates
What is solar panel degradation and what is the rate we use to assess this?
Lots of things improve with age, but the same cannot be said for a lot of the renewable energy equipment you invest in. Solar panel degradation can happen for a number of reasons. This article will explain what this degradation rate actually is and how to assess it.
When you invest in a PV solar plant, you need to consider several important characteristics to ensure the reliability of your project. One of the most discussed subjects with the lenders and/or stakeholders is the degradation rate of the solar panels. How can you be sure that this performance/degradation rate is accurate, and it is not too pessimistic (or optimistic)?
What is the ‘degradation rate’?
It’s important to understand what the term ‘degradation rate’ is. This term is used by the solar industry to describe a drop in the nameplate power of solar modules. Current technologies employed in the production of solar panels make this degradation unavoidable. However, the drop in the rate can be improved and its impact slowed, depending on the PV modules technology (m-Si or p-Si, thin film) used and/or PV modules manufacturer chosen (Tier 1 or not).
What is an accurate rate to consider?
When you invest in both greenfield and brownfield solar plants, you need to be careful about the assumption of the degradation rate.
For greenfield plants, it is common to consider in the first year of operation a degradation rate in the range of 1% to 2.5%. This is mainly caused by LID (Light Induced Degradation), which most affects p-Si modules bases. Thin film module bases are not affected by this phenomenon but they have a first-year standard degradation to be considered too (around 2% in average for the FS gen6 for instance).
For the long-term degradation rate, for operational year 2 to 20-25, the assumption needs to be reliable to assess the most accurate LCOE considered in your business plan.
Typically, as several research papers [1] report, a consistent degradation rate for silicon technology (c-Si, p-Si) is 0.4%-0.5%/year and for thin-film technologies (CdTE, CiGS) it is 0.5%/year. This rate can be adapted according to the manufacturers of the solar panels, which have specific technology (back contact, PERC). For instance, a degradation rate of 0.35%/year can be reasonably considered for mono-crystalline silicon modules with back contacts cells technology.
For brownfield PV plants, already in operation for several years, the degradation rate can be calculated using a different methodology, looking at historical data and specificities of the site (influence of the environment, abnormal defects or not in the panels etc.). It should be estimated considering your asset’s performance (key KPIs) or laboratory study [2].
How to assess the degradation rate?
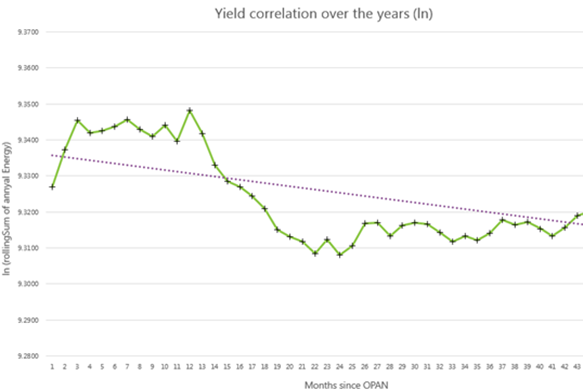
As a first step, we can correlate the real production of the PV plant with different KPI’s for the project (on-site Irradiation, variability of the solar resource, availability and Force Majeure events, temperature, etc) to manufacturers’ specification or industry recommendations. By analysing all the parameters together, it is possible to assess the performance and degradation of the entire PV plant during the operational years. Any underperformance can then be investigated further. One of the underlying causes can be panel degradation which can be confirmed by on-site measurements or laboratory testing. The type and scope of investigation can only be determined once the initial performance analysis is conducted.
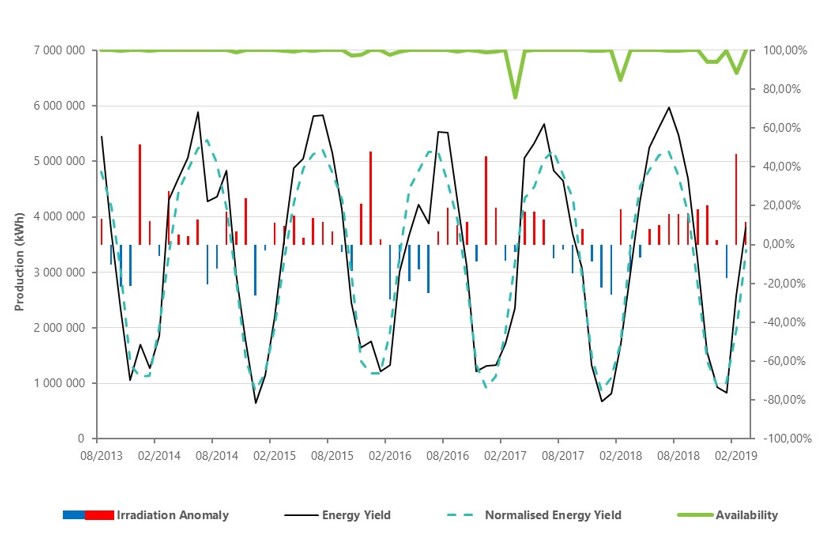
A simple health check using your historical data can tell us a lot about the performance of your assets.
How can Greensolver help?
Greensolver asset management and technical advisory experts can assist you with the evaluation of your solar panel degradation rate. This will ensure the assessment is a precise and that your business plan is as accurate as possible.
If you require further information or assistance, please contact the Greensolver team and we would be happy to help.
References:
[1] Dirk C. Jordan and Sarah R. Kurtz, Photovoltaic Degradation Rates — An Analytical Review, Journal Article NREL/JA-5200-51664 June 2012
[2] Tetsuyuki Ishii & Atsushi Masuda, Annual degradation rates of recent crystalline silicon photovoltaic modules, 10 July 2017 in Wiley Online Library, https://onlinelibrary.wiley.com/doi/epdf/10.1002/pip.2903
Article written by David Roissé (Senior Asset Manager).
The Latest Renewable Energy News


Greensolver at the Régate EnR — On board the Lucille Experience, Montpellier, 17–18 June