Using Thermographic Monitoring in Wind Turbines
Using Thermographic Monitoring in Wind Turbines
Your wind asset constantly operates to produce power day and night, and with it the electrical components are also in constant operation. The more your assets continue to operate over time, the higher the rate of component degradation will become. Wind thermographic monitoring is then an essential service to consider.
The Problem
The most evident indicator of component breakdown within a wind asset is heat radiation and dissipation. This will often go undetected by the human eye, as we cannot see the release of heat radiation, and eventually lead to asset downtime. Upon investigation into the root cause of asset downtime, the following issues can often be found:
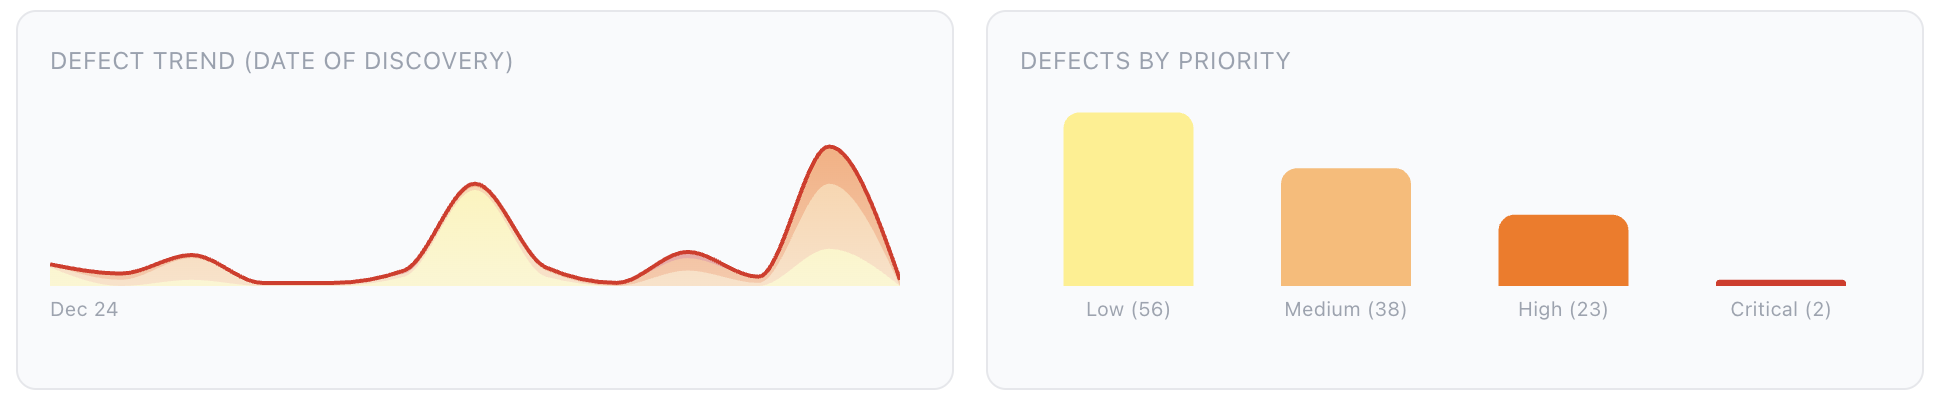
Although your wind turbine may have, on average, 50 temperature sensors installed, your asset contains thousands of pieces of electrical equipment, all operating at different temperatures. Whilst 50 sensors may seem more than enough, it is still extremely difficult to discern temperature increase indicating component failure.
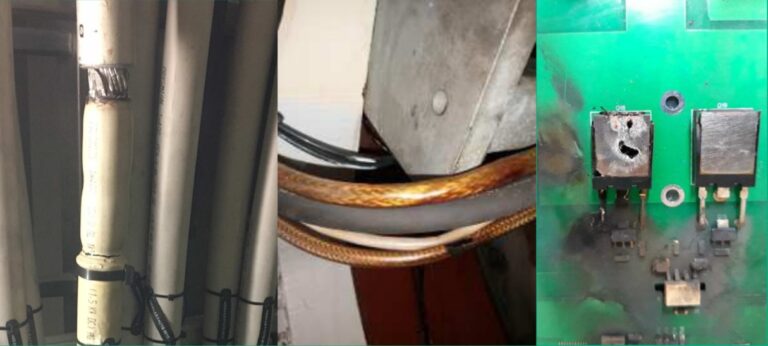
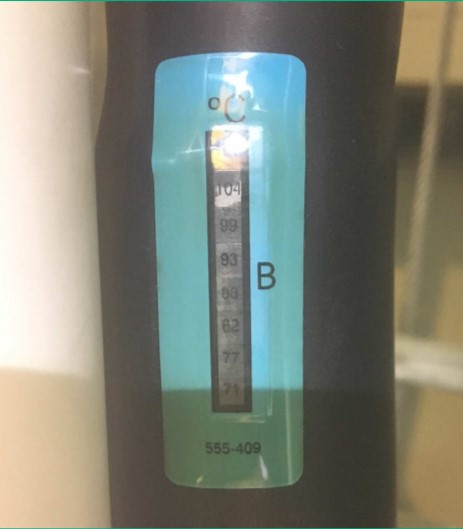
During Greensolver wind turbine inspections, we often observe signs of heat dissipation at consistent points within a wind asset. Cable joints, for instance, are often points of increased resistance within a circuit, making them optimum points for degradation and heat dissipation to occur. Greensolver are able to mitigate this particular issue by having temperature stickers installed on particular cable joints, as seen below:
Although Greensolver have a vast amount of knowledge and experience pertaining to the defects that can occur within a wind asset, the above solution still only allows us to mitigate against a very small portion of these issues. The vast majority of these issues will go unnoticed until component failure occurs, causing the asset owner a potentially significant loss of annual revenue.
The Solution
To overcome such issues, Greensolver’s thorough site inspection team strongly advise clients to use thermographic monitoring and infrared radiation on their wind assets. Infrared analysis uses IR to compare the difference in temperature between components in one or multiple views over time. The temperature differences can indicate an assets condition or performance before the issue causes component failure, saving asset owners significant amounts of time and money.
To view Greensolver‘s comprehensive scope of asset management and inspection services, click here.
Written by Jake Mason, Wind Farm & Turbine Inspection Manager
The Latest Renewable Energy News
Webinar Replay – Modeling the Economic Potential of BESS: How to Manage Uncertainty | June 17, 2:00 p.m. CET

Greensolver will be attending the 12th GreenUnivers Infrastructure Financing Conference on July 1
Greensolver at the National Event on “Flexibility in Renewable Energy and Storage” — July 2